Aging Bridges, Considerable Disrepair Are Significant Challenge in CT, Nationwide
/It was in 1983 that three people died in Connecticut when a section of the Mianus River Bridge on Interstate-95 collapsed into the water below, and unsuspecting drivers drove off the end of the road in the middle of the Greenwich night.
That tragedy launched a multi-million dollar infrastructure investment program in Connecticut, but now, three decades later, the age and condition of the state’s bridges is front and center again, as a poorly functioning, 118-year-old railroad bridge has disrupted commuter service on the nation’s busiest rail corridor by repeatedly refusing to close. 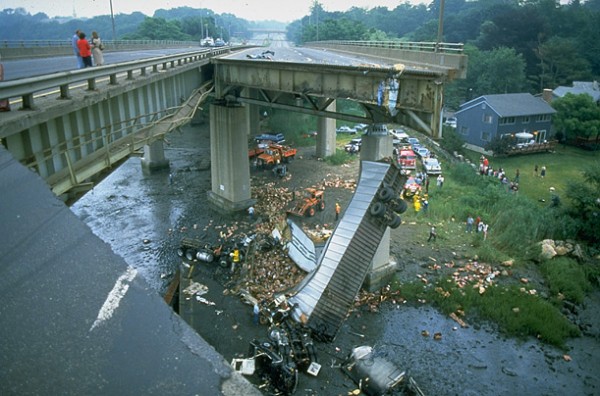
The extent of the nation’s bridge-related challenge is daunting, and yet represents only a portion of the overall infrastructure needs. Less than a year ago, a study released by the American Society of Civil Engineers determined that:
- over two hundred million trips are taken daily across deficient bridges in the nation’s 102 largest metropolitan regions
- one in nine of the nation’s bridges are rated as structurally deficient,
- the average age of the nation’s 607,380 bridges is currently 42 years.
The report also pointed out that “it is of growing concern that the bridges in our nation’s metropolitan areas, which are an indispensable link for both millions of commuters and freight on a daily basis, are decaying more rapidly than our rural bridges.”
 Once every four years, America’s civil engineers provide a comprehensive assessment of the nation’s major infrastructure categories in ASCE’s Report Card for America’s Infrastructure (Report Card). The most recent report was issued in 2013.
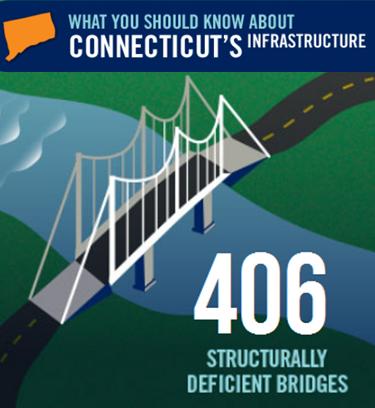
Connecticut, according to the data, has 406 of the state’s 4,208 bridges classified as structurally deficient and another 1,070 are considered to be functionally obsolete. The report also noted that Connecticut has 21,407 public road miles, and 73 percent of the state’s major roads are considered to be in poor or mediocre condition.
By county, the 406 structurally deficient bridges were: 106 in Fairfield County, 71 in Hartford County, 58 in New Haven County, 45 in New London County and Litchfield County, 27 in Middlesex County, 24 in Windham County and 14 in Tolland County. In addition, the report indicated that Connecticut had 1,023 functionally obsolete bridges in the state.
Structurally deficient bridges “require significant maintenance, rehabilitation, or replacement. These bridges, according to the report, “must be inspected at least every year since critical load-carrying elements were found to be in poor condition due to deterioration or damage.” Functionally obsolete bridges are those that “no longer meet the current standards that are used today. Examples are narrow lanes or low load-carrying capacity.” 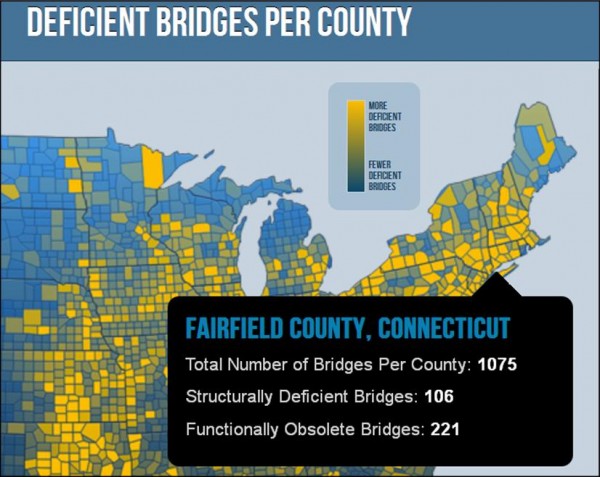
The Federal Highway Administration (FHWA) estimates that to eliminate the nation’s bridge deficient backlog by 2028, an investment of $20.5 billion annually would be needed, according to the report, while only $12.8 billion is being spent currently. The report stated that “the challenge for federal, state, and local governments is to increase bridge investments by $8 billion annually to address the identified $76 billion in needs for deficient bridges across the United States.”
The report indicated that 22 states have a higher percentage of structurally deficient bridges than the national average, while five states have more than 20% of their bridges defined as structurally deficient. Pennsylvania tops the list with 24.4%, while Iowa and Oklahoma are not far behind, each having just over 21% of their bridges classified as structurally deficient.
Overall, the nation’s grade for the condition of its bridges was C+, which was described as “mediocre” and in need of attention. “Some elements exhibit significant deficiencies in conditions and functionality, with increasing vulnerability to risk.” The 32-member Advisory Committee did not include any engineers from Connecticut, but did include two from Massachusetts and one from Maine, among the New England states.
Time magazine reported this week that the I-95 bridge over Delaware’s Christina River was quickly closed to all traffic on May 29, after “an engineer who happened to be working nearby noticed two of the span’s support pillars tilting.“ Officials hope to have the structure stabilized and reopened by Labor Day. The bridge had routinely handled about 90,000 vehicles per day.
The I-35W bridge over the Mississippi in Minneapolis collapsed during rush hour on August 1, 2007, plunging dozens of cars and their occupants into the river, killing 13 people and injuring 145. The bridge was Minnesota's fifth busiest, carrying 140,000 vehicles daily.![]()
The American Society of Civil Engineers, founded in 1852, is the country’s oldest national civil engineering organization. It represents more than 140,000 civil engineers in private practice, government, industry, and academia who are dedicated to advancing the science and profession of civil engineering. The first Report Card for America’s Infrastructure was issued in 1988.
 cal topic that relates to an annual theme, students conduct extensive research using libraries, archives, museums, and oral history interviews. Students analyze and interpret their findings, draw conclusions about their topic's significance in history, and create final projects that demonstrate their work.
 y. Participating students come from all over the United States, Guam, American Samoa, Department of Defense Schools in Europe, and affiliates in China, Korea, and Jakarta.


 The first Knights game took place on April 11, 2014. (photo at left) The stadium features a two-level club with skyline views as well as a VIP, climate-controlled club with full service bar. In addition to corporate suites, there are 987 club seats at the new Charlotte stadium. Of those, 170 on the upper level sell for $41.50 per game, or nearly $3,000 per season. The remaining 817 club seats, at $21 per game, sell for about $1,500 annually. All of the club seats were sold out 10 months prior to the season opener, according to the Knights


 e rankings is the Washington, D.C., metro area with a score of 77.3, followed by Minneapolis-St. Paul, Portland, Denver, San Francisco, San Jose, Seattle, San Diego, Boston Sacramento and Salt Lake City.
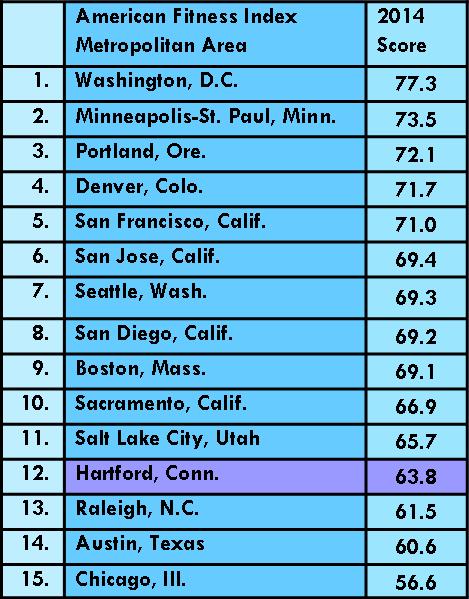 Hartford-East Hartford
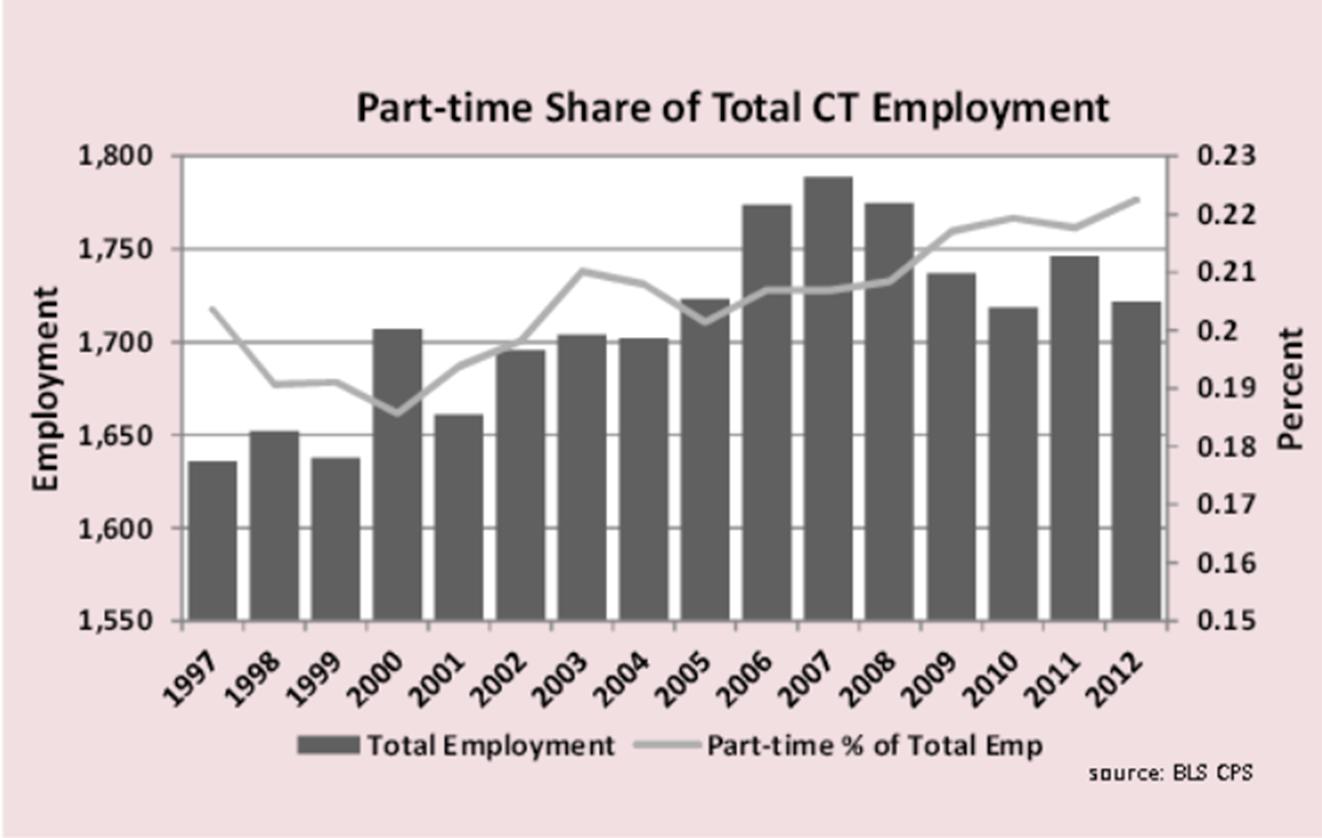
 a and the basis for the analysis. The breakdown of hours worked shows that Connecticut has less under 35 hours per week employment than other New England states but more than the Northeast region overall.
Part-time employment was 23.3% of all New England employment in 2012, higher than any other census division in the country. The other eight census divisions averaged 19.3% with the West- South Central division lowest at 16.4%.
a and the basis for the analysis. The breakdown of hours worked shows that Connecticut has less under 35 hours per week employment than other New England states but more than the Northeast region overall.
Part-time employment was 23.3% of all New England employment in 2012, higher than any other census division in the country. The other eight census divisions averaged 19.3% with the West- South Central division lowest at 16.4%.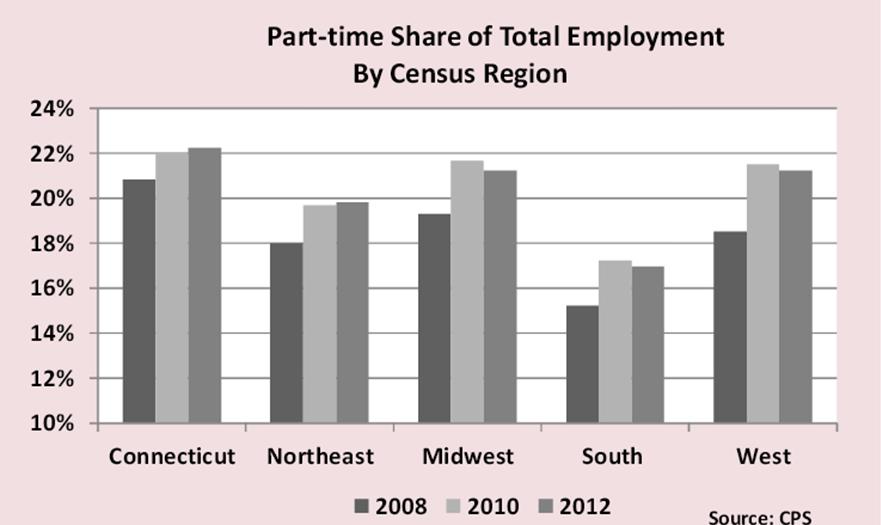
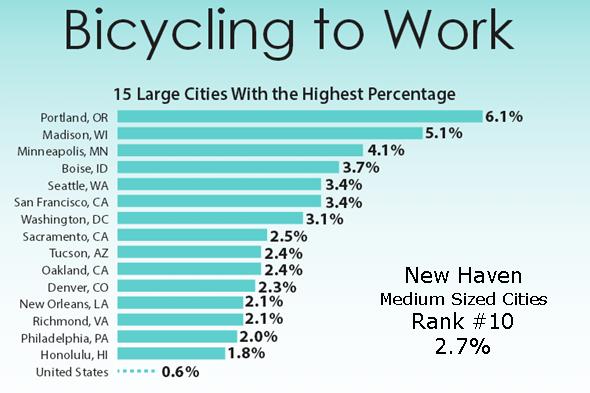 y bicycle remains low, according to the U.S. Census American Community Survey. In 1980, 0.5 percent of workers commuted by bicycle. This rate dropped to 0.4 percent in 1990, where it remained in 2000, before nudging upward in the latest survey.
 Among the nation’s medium sized-cities, (with p
 opulations between 100,000 and 199,999) New Haven ranks at #5 with 12.4 percent walking to work and at #10 with 2.7 percent of the population using bicycles to get to work. Hartford ranks at #10 among the top walk-to-work medium sized cities with 8.2 percent, and did not reach the top 15 in bicyclists.
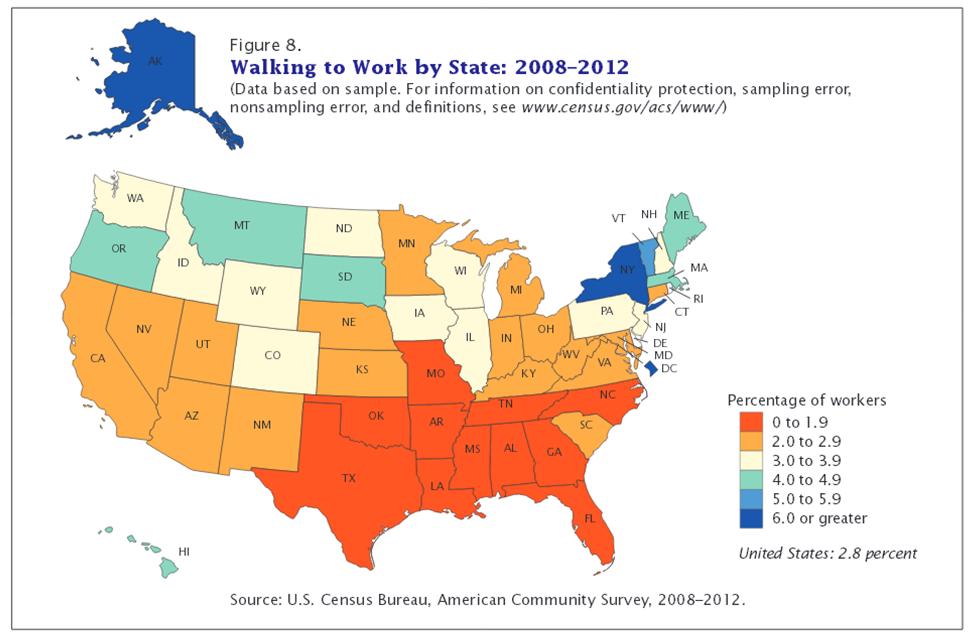 average commute to work in Connecticut is about 25 minutes, ranging from 28 minutes in Fairfield County, 27 minutes in Litchfield County, 26 minutes in Windham County, 25 minutes in Middlesex County and Tolland County, to 24 minutes in New Haven County, 23 minutes in New London County, and 22 minutes in Hartford County.

 percent of the total population, older adults over the age of 65 years old accounted for more than 28 percent of pedestrian fatalities between 2003 and 2010 and a pedestrian fatality rate of 2.76 in Connecticut. The worst state pedestrian fatality rates (per 100,000 persons aged 65 and older) are in Hawaii, California, New York, District of Columbia, Florida, Nevada, New Jersey Utah and Idaho.
 She has become the fastest in the world to complete the "GWR Hasbro Puzzle,” assembling the unique and challenging jigsaw puzzle at a rapid rate of 18 pieces per minute, completing the puzzle in 13 minutes and seven seconds. Her time beat the previous record of 13 minutes and 14 seconds.
 aw puzzle is an oval shape and has no guiding picture on the box. Most of the pieces are very similar in appearence.