More Social Capital = Fewer Traffic Accidents, Research Study Finds

If you’ve never made a connection between traffic accidents and social capital, you’re probably not alone.  However, the Harvard Business Review (HBR) is reporting on research by Matthew G. Nagler of the City College of New York which found, perhaps surprisingly, that a 5% increase in the average level of agreement with the statement "most people are honest" within a U.S. state results in a decline in traffic fatalities in that state by about 11%. The “most people are honest” statement is a measure of trust in others that is an indicator of the state's level of social capital, sometimes defined as a willingness to engage in community activities. Less-conscientious people who reject civic engagement presumably drive more recklessly, HBR reported.

Nagler’s abstract for the researchCarAccidentSafety_main_022
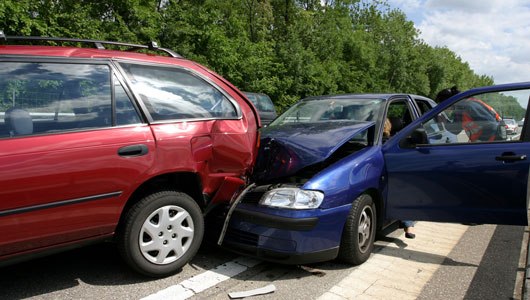
, to be published next month in the journal Economic Inquiry, explains thatevidence that social capital reduces traffic accidents and related death and injury, using data from a 10‐year panel of 48 U.S. states show that social capital has a statistically significant and sizable negative effect on crashes, traffic fatalities, serious traffic injuries, and pedestrian fatalities that holds up across a range of specifications.”

In case you were wondering, Nagler – an Associate Professor in the Department of Economics - did not want the research unduly impacted by snow-related accidents, so he used only data from summer months.  The research data used was from 1997 to 2006. His research paper is entitled “Does Social Capital Promote Safety on the Roads?”

The death toll in the U.S. from traffic accidents has been approximately 43,000 deaths annually, according to the report. Traffic fatalities remain a major cause of death at all ages and the leading cause for persons under the age of 44.

In the paper’s conclusion, Nagler notes that the results of his study “parallel prior findings with respect to social capital’s beneficial effects on economic growth and various health outcomes.”  In 2004, a study by three University of Connecticut researchers found that social capital is associated with decreased risk of hunger.“Households may have similarly limited financial or food resources, but households with higher levels of social capital are less likely to experience hunger,” they concluded.

Being A Good Neighbor, Connecticut Exceeds National Average

Do you trust your neighbors?  Data compiled by the National Conference on Citizenship indicates that Connecticut residents outpace the national average on the neighborliness scale.  The report indicates the 17.9% of Connecticut residents trust “all of the people” in their neighborhood, compared with 15.6% nationally.  In addition, 43.6% of Connecticut residents trust “most of the people” in their neighborhood, slightly higher than the national average of 41.1%. The study, done in conjunction with the Corporation for National & Community Service, also found that 72.8 percent of Connecticut residents “do favors for their neighbors” – again exceeding the U.S. average of 65.1%.

Social cohesion, highlighted in the NCoC report Volunteering and Civic Life in America,  is made up of key indicators of how individuals engage with their neighbors—how often do we talk with one another, help each other out, and how much do we trust the people in our communities? High levels of social cohesion are critical to individual and community well-being.

The data shows that these areas are worth exploring and strengthening further across the country, the organization reported. Just 13.3% of Americans said that they talk with their neighbors every day and 30.4% do a few times a week. However, a full 13.5% of Americans report never talking with their neighbors. neighbors When asked if they exchange favors with neighbors, such as watching each other’s children, helping with shopping, or lending garden or house tools, only 14% of Americans do so everyday or a few times a week. A striking 35% of Americans report never engaging in this behavior.

Looking out for one’s neighbors often connects directly to levels of trust in a neighborhood. Of individuals that indicated they trust all or most of their neighbors, approximately 4 in 5 (77%) said they do favors for their neighbors a few times per year or more. In contrast, of individuals that indicate they trust none of their neighbors, only 24% said they do favors for their neighbors.

Nationally, 15.6% of Americans report they trust all of their neighbors, 41.1% report they trust most, 34.6% report they trust only some, and 8.7% trust no one in their neighborhood.

The 2013 National Conference on Citizenship will be held September 19-20 in Washington D.C. The theme for this year's conference is "America's Charter: Past, Present, and Future." Throughout 2013, NCoC celebrates the 60th anniversary of the organization’s Congressional charter, which charged them to explore the meaning of and find ways to increase active citizenship in America. The event and celebration will help participants “understand the significance of where we've been as a country, the civic reawakening we are experiencing now, and how we carry this revitalized sense of purpose forward.”

CT Receives Recognition for Economic Development

The Connecticut Department of Economic and Community Development has received national recognition from a top site selector organization for its economic development efforts.  DECD was selected to receive the 2013 Site Selectors Guild Award for its work with Tronox Inc., a chemical company that announced in 2012 that it would be locating its world headquarters in Stamford.  The Site Sectors Guild is a professional association that includes some of the worlds most respected site consultants. The most recent recognition underscores ongoing efforts of DECD, which include highlighting Connecticut's strong position to attract and grow businesses.  Some of the noteworthy stats:

  • Connecticut is a leader in patents, ranking 8th in the nation.
  • Connecticut is a leader in business research and development, ranking #1 per capita.
  • Connecticut is a global competitor, ranking #6 in world GDP per capita.
  • Connecticut’s workers are among the most productive in the nation, ranking fourth among states.
  • Connecticut is a leader in venture capital deals, which are key to the development of small business, ranking #7.
  • The state ranks 9th in the nation as a leader in the New Economy.
  • Connecticut is a leader in finance and insurance, ranking #2 in total employment.
  • Connecticut is a leading exporter ranking tenth in per capita exports.
  • Connecticut has a highly educated workforce ranking third with an adult population with advanced degrees.
  • Connecticut ranks 6th in the number of scientists & engineers per 100,000 employees.

The data, provided by CL&P's Connecticut Economic Review 2013 and The Information Technology & Innovation Foundation, reflects a mix of widely known and virtually unknown stats about Connecticut workforce and global position in a range of industries.

CT Ranked #4 as More Students Succeed on AP Exams; Gap Widens for Latino, Black Students

The College Board, in its annual report on the state of the Advanced Placement program – known to high school students as AP classes – determined that mean scores and overall participation in the AP exam both grew last year, but inequities in the availability of the exams and programs persists across socioeconomic and racial backgrounds. Connecticut ranked #6 nationally in the percentage of 2012 public high school graduates succeeding on AP exams, but disparities continued in Connecticut and nationwide in the number of minority students taking and succeeding in AP classes.  The state ranked #4 in the nation for the largest change in the overall percentage of students scoring well on the AP Exam, from 15.5 percent in 2002 to 26.9 percent in 2012, a jump of 15.5 percent.

Data indicate that in Connecticut, however, the gap widened from 2011 to 2012 in the percentage of African-American students and Latino students in the graduating class who took AP classes.  Ten states eliminated the gap for Latino students; three states did so for African-American students.

The publication Inside Higher Ed noted that the report designated “promoting equity” as a major goal for the AP program in the coming years, and although lack of equal access and opportunity remains an issue, the findings rAP-Classes-and-Ivy-League-Admissioneported several positive signs over the past year in this regard.  The report states that in 2012, disparities in participation and success shrank in 30 states for African-American students and in 17 states for Latino students.

Among the class of 2012, more than 300,000 students identified as having a high likelihood of success in AP did not take any recommended AP Exam. To succeed on an AP exam, students need to score a 3 or higher on a 5-point scale. Many colleges and universities offer college credit for passing scores. AP courses are offered in a variety of subjects, including math, science, foreign language, English and history.

According to the report, nationwide the number of high school graduates taking the AP exam in 2012 was 954,070, or 32.4 percent, up from 30.2 percent in 2011, and 18 percent a decade earlier, in 2002. Hundreds of thousands of academically prepared students with the potential to succeed in AP — including a disproportionately large percentage of underserved minority students — are graduating from high school without having participated in AP classes.

AP participation also increased among low-income graduates, who accounted for 26.6 percent of students who took at least one AP examination. This is an increase from 11.5 percent in 2003.

ctlatinonews.com cited ABC News Univision in reporting that more Latinos are taking the test than in previous years, according to the report, and more of them are succeeding. But the data revealed significant inequities in AP participation along racial/ethnic lines, with underserved minority students who demonstrated readiness for AP much less likely than their similarly prepared white and Asian/Asian American/Pacific Islander peers to experience AP course work.

Writing in the Miami Herald, Trevor Packer, Vice President of the Advanced Placement Program at The College Board, pointed out that “Under-represented minority students who show readiness to succeed in AP are less likely to actually take AP than their white and Asian peers. In AP math course work, for example, among every 10 students who are ready for an AP math course, 60 percen435876254t of Asian students, 40 percent of white students, 30 percent of Latino and African-American students, respectively, and 20 percent of American Indian/Alaska Native students participate in the program.”

Why are many minority students not enrolled in advanced placement classes? One reason cited in the report is a lack of access. Many attend school where the coursework is simply not available. The report offers suggestions for improving access to AP courses, while noting that schools can run into obstacles such as a lack of funding or properly trained teachers.  Schools need to do a better job of notifying students that they are eligible for the courses, the report says. Once students are enrolled, the report says that schools should provide support, in the form of peer-to-peer mentoring, counseling and tutoring.

Top 10 States in Percentage of 2012 Public High School Graduates Succeeding on AP Exams

  1. Maryland (29.6%)
  2. New York (28.0%)
  3. Massachusetts (27.9%)
  4. Florida (27.3%)
  5. Virginia (27.2%)
  6. Connecticut (26.9%)
  7. Maine (24.8%)
  8. California (24.7%)
  9. Colorado (24.2%)
  10. Vermont (22.8%)


CT AARP Steps Up Focus on Entrepreneurs, Business Development

Next month, AARP and the U.S. Small Business Administration (SBA) are teaming up to host National Encore Entrepreneur Mentor Month, targeted at new business owners age 50 and over and those interested in starting a business.  The goal is to match these “encore entrepreneurs” with experienced business owners and community leaders for advice and assistance, and to link them to the resources they need to successfully start and grow their businesses and create jobs. Consistent with the organizations’ mission, the Connecticut AARP chapter views social enterprise as a valuable opportunity for age 50+ entrepreneurs – also known as “Encore Entrepreneurs” – and active retirees with sharp business and entrepreneurial acumen.  With one in four Americans ages 44 to 70 interested in becoming entrepreneurs, and a large majority planning to work during retirement, small business ownership is described as a solid option.

In addition to planned programs during April, the Connecticut AARP has announced support for legislation proposed by Governor Malloy’s (SB6356) which would help AARP members formalize their commitment to creating public good. The bill is designed to help address a variety of social concerns, through business rather than public funds or philanthropy, that are core to AARP’s mission, such as hunger, economic insecurity, housing and isolation.  AARP has ongoing partnerships with the U.S. Small Business Association (SBA), nationally and state-wide, and with co41592_130564031656_4369100_nmmunity partners in Connecticut including Social Enterprise Trust (reSET) and the Women’s Business Development Center (WBDC).

The bill before the legislature aims to help attract and keep social entrepreneurs and social enterprise investors in Connecticut and provides a heightened level of transparency and protection as compared to other states with similar legislation, according to AARP. Among the beneficiaries:  “Encore Entrepreneurs” seeking purpose beyond profit, community based organizations seeking to partner for social benefits, age 50+ workers seeking employment opportunities in a down economy, and the State by creating a new source of revenue through the payment of up-front incorporation filing fees and annual taxes.

National Encore Entrepreneur Mentor Month is part of a larger effort by AARP and SBA to promote entrepreneurship among individuals ages 50+.  It will consist of events across the country, including two in Connecticut, on April 16 in Waterbury and April 18 in Bridgeport, that will link individuals with local resources and mentor opportunities to help them successfully start and grow a small business.

The initiative includes AARP’s Work Reimagined, a unique new way for experienced workers to advance themselves in today’s tight job market.  Work Reimagined is a social network based jobs program that connects employers seeking experienced workers with qualified professionals searching for new or more satisfying careers.  The site, www.workreimagined.org, leverages the platform of professional networking site, LinkedIn, which is used by more than 15 million people aged 45-64.

AARP’s Work Reimagined and other resources for experienced workers over age 50 are slated to be highlighted in a segment on WTNH’s Connecticut Style program airing Wednesday, April 3, 2013 at 12:30 p.m.

The in-person AARP/SBA workshops in April will feature presentations by SBA, SCORE, reSET (Social Enterprise Trust), The Women’s Business Development Council (WBDC), People’s Bank and local economic development agencies.  Attendees will have the opportunity to ask questions and speak individually with representatives, as well as network with other small business owners and “would be” entrepreneurs. Registration is required.

April 16, 2013 in Waterbury   9 a.m. – 12 p.m. (noon)

Silas Branson Library, 267 Grand Street, Waterbury, CT

To register, call 1-877-926-8300 or register online

April 18, 2013 in Bridgeport   9 a.m. – 12 p.m. (noon)

City Hall Annex, 999 Broad Street, Bridgeport, CT

To register, call 1-877-926-8300 or register online.


Nonprofit Density Impacts Unemployment Rate; CT Misses Top 10

Communities with better civic health have weathered the recent recession far better – and experienced considerably smaller increases in unemployment – than other communities that faced similar economic circumstances, according to a report by the National Conference on Citizenship (NCoC).  Counties across the nation that were rich in nonprofit organizations lost considerably fewer jobs than the low-nonprofit counties, the study revealed. A state-by-state analysis by the organization placed Connecticut in the second tier of states in both the density of nonprofit organizations, and social cohesion (interacting with friends and neighbors), the two measures used in the study, released in 2012.  Connecticut ranked between #11 and #20 in each category, just outside the first tier, top-10 states.

For individuals who held jobs in 2008, the odds of becoming unemployed were cut in half if they lived in a community with many nonprofit organizations rather than one with a few nonprofits, even if the two communities were otherwise similar, theNCoC study found.  Among the New England states, Maine, Rhode Island and Vermont placed in the top ten.

Overall, counties with more nonprofits per capita prior to the recession had lower unemployment in 2006. And while almost all of the counties lost jobs during the recession years, the counties with more nonprofits per capita lost fewer jobs between 2006 and 2009. Both patterns remain even when holding education, median income, housing prices, and other economic factors constant, according to the report.  Counties ranking in the top 10% in nonprofit density experienced an increase of only 2 percentage points in their unemployment rate between 2006 and 2009, compared with 5.1 percentage points for the counties in the bottom 10% in nonprofit density.

These results suggest – according to the report – that nonprofits may bring economic benefits by directly employing people and also by changing the economic climate of the whole community. Nonprofits support civic engagement and social cohesion; in turn, when citizens feel committed to their communities and connected to their fellow residents, they are more likely to make decisions that boost local employment.

The study used statistical models to investigate the relationship between civic health and unemployment in the 50 states, 942 metro areas, and more than 3,100 counties since 2006.  NCoC was chartered by Congress intop 10 1953 to harness the patriotic energy and national civic involvement surrounding World War II. In 2009, Congress  expanded the organization’s Civic Health Assessment to become the nation’s largest and most definitive measure of civic engagement.


Towns and Cities Look to Varied Housing Options, Community Engagement

Many municipalities across Connecticut and New England are finding that community engagement – proactively, thoughtfully and creatively asking their residents for their attention and ideas about proposed housing and commercial development – pays off big time. That was evident last month at UMass/Amherst when three federal agencies – HUD, EPA and DOT – along with the Funders’ Network for Smart Growth and Livable Communities brought together experts and advocates from the region to discuss the best ways to merge affordable housing creation, transit and livable, sustainable and environmentally sound practices.

A growing number of organizations and government entities – municipal and regional – are using or promoting community engagement because the changing housing market is moving many more communities to increase their efforts at housing creation. A wider array of housing options – smaller, denser, more affordable, energy-efficient, walkable and, if possible, close to transit – are being utilized to meet the needs of empty-nesters, young professionals and families, and workers in a region that, despite a falloff in demand, has seen rental and purchase prices remain very high.video clip

The Partnership for Strong Communities highlighted community engagement strategies it promotes, including its new video about five very different Connecticut communities – Hamden, Old Saybrook, Colchester, Bristol and Simsbury – that have used an array of community engagement methods – charrettes, town meetings, websites and crowd-sourcing among them – to harvest ideas and achieve buy-in for their development plans.

The organization embarked on a search to discover how communities can balance multiple priorities and opinions, and achieve development that most residents can be satisfied with.  Partnership staff drove around the state and filmed interviews with about 30 individuals involved in this work.  The resulting video, along with supporting materials, reflects how five different communities with different goals, used different methods to achieve a single outcome.

International Students Are Half of UConn MBA Class of 2013

The Class of 2013 student profile for the University of Connecticut’s School of Business provides interesting insight into those going through UConn to make their mark on the business world.  The university’s website reports the stats are an indication of the program’s “success in recruiting top-notch talent from a myriad of backgrounds.”  Of particular note:

  • 69% of the students are male, 31% are female
  • 50% are from the United States, 50% are international students
  • Among the states represented are Connecticut, Florida, New Jersey, New York, Utah, Virginia and Wisconsin
  • Among the nations represented are China, India, Japan, Serbia, Taiwan, Thailand, Vietnam and the U.S.
  • The undergraduate degrees of the MBA students are 31% business, 21% humanities/social studies, 17% engineering, 11% math/physical science, 7% economics, and 2% information science/computer science.2010class_ugdegree
  • The average years of work experience is 5.1
  • The average age is 28

The UConn School of Business was recently ranked among the Top 40 programs in North America and Top 200 worldwide for three graduate programs. The rankings were awarded by Eduniversal's Top 200 "Best Masters and MBA Worldwide" 2012-2013, which provides a global overview of the best post-graduate programs in 30 specializations in 153 countries. The programs and rankings were:

All of which are numbers and notoriety to ponder when encountering students coming and going from UConn's distinctive School of Business in downtown Hartford.

Sustainability, Green Infrastructure Advance in CT

green-energyWhen considering Connecticut’s progress in sustainability, green infrastructure, and green investments, a variety of statistics help to tell the story.  Among them:

  • The U.S. Department of Energy considers 13 percent of Connecticut’s electricity as coming from renewable resources, ranking the state 31st in the nation.  The majority of the renewable power comes from biomass and hydropower, as reported in the Connecticut Green Guide (www.CTGReenGuide.com).
  • Connecticut’s transportation sector employees more green workers than any other industry in the state, with 8,238 green jobs.
  • In the Northeast, 76 percent of companies use at least one type of green technology or practice.  According to the U.S. Bureau of Labor Statistics, the most popular green methods are:
  1. Energy efficiency
  2. Waste reduction
  3. Conserving natural resources
  4. Reducing greenhouse gas emissions
  5. Removing pollutants from workspace
  6. Generating onsite renewable energy
  • Connecticut Innovations, the state’s quasi-public investment firm, currently puts 6 percent of its portfolio into clean technology start-ups.  Here’s the portfolio breakdown:
  1. Information technology               49.5%
  2. Bioscience                                           42%
  3. Clean tech                                           6%
  4. Photonics                                            2%
  5. Advanced materials & other       .5%


  • The U.S. Energy Information Agency reports that Connecticut ranks fifth in the nation among the states consuming the least amount of energy per capita.  The top ten:
  1. Rhode Island
  2. New York
  3. Hawaii
  4. California
  5. Connecticut
  6. Massachusetts
  7. Arizona
  8. New Hampshire
  9. Florida
  10. Vermont


  • Connecticut leads the New England states in demand response resources – businesses and facilities that power down when electric prices and demand spikes, according to data from ISO New England.

State                                     Megawatts of Demand Response

Connecticut                        996.6Picture1

Massachusetts                  800.5

Maine                                   447

New Hampshire              183.2

Vermont                              144

Rhode Island                      140


Among the most common practices used by employers are asking employees to conserve, turn off or dimming lights, adjusting indoor temperature, and turning off equipment such as printers, copiers, and PCs).  Other steps, used less often, include shutting down production, starting emergency generation, limiting the use of elevators and escalators, and shutting down an entire plant.


Foreclosure Rate Drops Nationally, CT Better Than National Average

Foreclosure filings — default notices, scheduled auctions and bank repossessions — were reported on 150,864 properties across the U.S. during January, a decrease of 7 percent from the previous month and down 28 percent from January 2012. The report - by RealtyTrac®, a leading online marketplace for foreclosure properties and real estate data - shows one in every 869 U.S. housing units with a foreclosure filing during the month, down 28 percent from a year ago to the lowest level since June 2006 — a 79-month low. Each of Connecticut’s eight counties is below the national average, and the state continues to be outside the top 10 states for the number of foreclosures, according to the U.S. Foreclosure Market Report™ for January 2013.  The prevalence of foreclosures, based on the number of housing units, was greatest in Windham, Tolland, and New Haven Counties.

The Florida foreclosure rate ranked highest among the states for the fifth month in a row. One in every 300 Florida housing units had a foreclosure filing in January — more than twice the national average. A total of 29,800 Florida properties had a foreclosure filing during the month, up 12 percent from the previous month and up 20 percent from January 2012.MapPic_000918

With one in every 344 housing units with a foreclosure filing in January, Nevada posted the nation’s second highest foreclosure rate for the fourth consecutive month. A 32 percent month-over-month jump in scheduled foreclosure auctions helped the Illinois foreclosure rate rise to third highest among the states in January. One in every 375 Illinois housing units had a foreclosure filing during the month.

Other states with foreclosure rates among the nation’s 10 highest were Arizona (one in 501 housing units with a foreclosure filing), Georgia (one in 513 housing units), Ohio (one in 612 housing units), Washington (one in 674 housing units), California (one in 753 housing units), Indiana (one in 784 housing units), and Michigan (one in every 837 housing units).

In Connecticut, New Haven County had the largest number of foreclosures in January, with 317, followed by Hartford County with 265 and Fairfield County with 193.  Overall, Connecticut had 5,187 home foreclosures during the month, with the average foreclosure sales price of $186,405.  The county-by-county breakdown:

  • Windham            51 foreclosure properties             1 in every 958 housing units
  • Tolland                 52 foreclosure properties             1 in every 1,109 housing units
  • New Haven        317 foreclosure properties          1 in every 1,138 housing units
  • Hartford               265 foreclosure properties          1 in every 1,409 housing units
  • Litchfield              57 foreclosure properties             1 in every 1,530 housing units
  • New London      78 foreclosure properties             1 in every 1,546 housing units
  • Fairfield                193 foreclosure properties          1 in every 1,865 housing units
  • Middlesex           37 foreclosure properties             1 in every 2,013 housing units

In New Haven County, the numbers were driven by Waterbury with 84 foreclosures and New Haven with 59.  West Haven had 38 during the month.  In Hartford County, there were 44 foreclosures in New Britain, 35 in East Hartford and 26 in Manchester, according to the data provided by RealtyTrac.