Connecticut Ranks #30 in Nation in Native Born Residents; Louisiana #1, Nevada Has Least

Just over half of Connecticut’s residents were born here, ranking the state 30th in the nation for the percentage of population who are native born.

Data from the U.S. Census Bureau’s American Community Survey, as analyzed by AARP, indicate that 55.2 percent of Connecticut residents were born in the Constitution State.   That places Connecticut fourth30 in New England, behind Massachusetts, Maine and Rhode Island.

The top 8 states with native born residents – all above 70 percent - are Louisiana, with 78.7 percent, followed by Michigan (76.7%), Ohio (75%), Pennsylvania (73.8%), Mississippi (72%), Iowa (71.6), Wisconsin (71.5%) and Alabama (70.2%).  The Rust Belt and Deep South generally had the highest percentages of resident born and raised in the states were they still live.

The lowest percentages of native born residents were in the states of Nevada (25%), Florida (35.7%), the District of Columbia (37%), Alaska (40.4%), New Hampshire (42%)  and Colorado (42%) .  The only Western state above 60 percent was Utah, at 61.8 percent.

In the tri-state region, native New Yorkers came in at 63.6 percent (ranked #18) and New Jersey at 52.6 percent, slightly lower than Connecticut.  Just one-tenth of a percent ahead of Connecticut was Georgia, with 55.3 percent.Born-in-the-USA

Just behind Connecticut in the rankings at #31 was California, with 54.5 percent of residents born in the state, and Hawaii, at 54.2 percent.

In thirteen states and Washington, D.C. – mostly in the West but also including Delaware (44.9%) and New Hampshire (42%) - less than half of residents are native sons and daughters.

1.       Louisiana78.7%

2.       Michigan 76.7%

3.       Ohio 75.0% 4.       Pennsylvania 73.8%

5.       Mississippi 72%

6.       Iowa 71.6%

7.       Wisconsin 71.5%

8.       Alabama 70.2%

9.       West Virginia 69.6%

10.   Kentucky 69.8%

11.   Indiana 68.4%

12.   Illinois 66.9%

13.   North Dakota 66.9%

14.   Missouri 66.6%

15.   Maine 65.2%

16.   Nebraska 65.1%

17.   South Dakota 64.4%

18.   New York 63.6%

19.   Massachusetts 63%

20.   Utah 61.8%

21.   Arkansas 61.5%

22.   Tennessee 61.4%

23.   Oklahoma 60.9%

24.   Texas 60.6%

25.   Kansas 59.4%

26.   Rhode Island 58.1%

27.   North Carolina 58%

28.   South Carolina 58.25

29.   Georgia 55.3%

30.   Connecticut 55.2%

31.   California 54.4%

32.   Hawaii 54.2%


Frequent Gamblers Prefer Atlantic City; Connecticut Casino Customers Satisfied As Competition Grows

A new study shows that the Atlantic City casinos continue to lead the way in attracting the gamblers who visit casinos most often, but Connecticut’s casinos are not far behind.  The review of players club members at casinos throughout the mid-Atlantic region reflects an industry becoming more competitive as frequent gamblers have more choices.  The study found that

Foxwoods- table

  • the region’s biggest gamblers are playing in Atlantic City, NJ
  • frequent gamblers at Connecticut's casinos bring more than $300 to gamble
  • gamblers frequenting upstate New York casinos have the lowest daily gaming budget in the Mid-Atlantic region
  • table gamblers generally have an average gambling budget of almost twice that of slots player,
  • 35-44 year olds bring the most gambling money to the casinos.

The casino markets included in the survey were New York, New Jersey, Pennsylvania, Connecticut, Delaware, Maryland and Massachusetts.  The survey, called Casino SCORES, conducted 3,000 interviews with individuals who live in one of the states, had made at least three visits to a casino in the region during the past year, and were members of at least one players club.

The study asked gamblers their average ddaily gamling
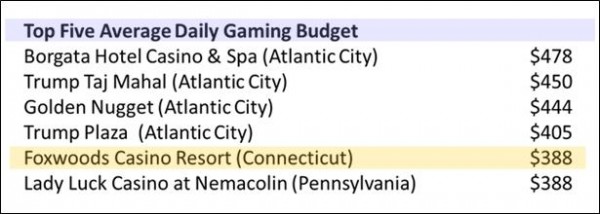
aily gaming budget when going to casinos in the  region. Of the 43 casinos evaluated in the study, the highest daily gaming budgets were among individuals that go to the Atlantic City casinos most often, followed by Foxwoods in Connecticut and Lady Luck Casino at Nemacolin Resort in Pennsylvania.

The top five average daily gaming budgets were:  Borgata Hotel Casino & Spa (Atlantic City), $478; Trump Taj Mahal (Atlantic City), $450; Golden Nugget (Atlantic City),  $444; Trump Plaza, (Atlantic City), $405; and Foxwoods Resort Casino (Connecticut), and Lady Luck Casino at Nemacolin (Pennsylvania), both at $388Mohegan Sun was further down the list at $324, but well above the majority of casinos.  The bottom five, all in New York, ranged from $205 down to $120 average daily individual gaming budgets.

The Average Daily Gaming Budget among those who said they play table games most often was $493, compared with $250 among those who responded that they play slots most often.

The survey also found that the 35-to-44 year old age bracket brings the most money with them to the casino they visit most often, compared with other age groups. 21 to 34 -  $334 35 to 44 - $359 45 to 64 - $308 65 and over - $288

Among those surveyed who had joined at least one casino's players club, 41 percent did so at an Atlantic City casino, 31 percent were members of Mohegan Players Club, and 25 percent joined Foxwoods Rewards.  Membership overlapped, as some individuals surveyed were members of more than one players program.

Competition To Retain, Attract Frequent Gamblers Intensifying

With Massachusetts moving forward with its  casino licensing process, the region will continue to see heightened competition in the coming years.  A new casino opened in Maryland last year, and two more are planned in the next three years.   The increasing competition is already having an impact on the revenue stream to the state in accordance with longstanding exclusivity agreements.  At the end of the fiscal year last summer, the two Connecticut casinos sent a total of $296.4 million to the state, a drop of almost $48 million from fiscal 2012.

Massachusetts’ regulators recently awarded a slot parlor license to Plainridge Racecourse which is just 20 miles from Twin River Casino in Lincoln, Rhode Island.  The Massachusetts gambling commission expects to award the license  for Western Massachusetts in May, with an MGM proposal for Springfield the only project left in the running after a Mohegan Sun proposal was defeated in a  local referendum in nearby Palmer. In addition, two proposals are competing for the license in the greater Boston region, Mohegan Sun in Revere and Wynn Resorts in Everett.

“As competition heats up, foxwoodskeeping and growing loyalty is going to be key,” said John Antonello, Managing Director of Travel and Leisure Entertainment for  Phoenix Marketing International (PMI).  “The more perks that are provided, the better.”  The trend is for loyalty programs to get “more sophisticated, so they can extend their reach,”   Antonello added.

Both Foxwoods and Mohegan Sun players club members indicated a “good level of satisfaction,” with the benefit program currently offered,” Antonello said, reflecting program elements including restaurant dining and shopping discounts, complementary hotel rooms on-site, reserved parking, VIP check-in and special gaming events.  Mohegan Sun, for example, offers three levels of benefits to cub members, Foxwoods offers five.

The data offered in the survey also includes cross-tabulations that indicate to which loyalty programs in other industries the club members at specific casinos belong  – which can provide individual casinos a road map suggesting which perks might be most attractive to their existing customers.  For example, 37 percent of Foxwoods club members are also members of Marriott Rewards, and one-third are members of airline prmohegan sunograms, such as Delta, American or JetBlue.  Those aspects of the survey are proprietary, and available to clients of Phoenix.

Antonello said that players club programs are rapidly evolving, and are reminiscent of the hotel loyalty programs of just over a decade ago, when they aggressively began adding new perks to retain customers amidst growing competition.  “Casinos are now looking for partnerships with other entertainment and travel companies as they go after a broader audience. The trend is to go beyond one industry,” he said.  Foxwoods Rewards partners program, for example, now includes discounts at businesses ranging from FTD Florist to Mystic Acquarium and the Connecticut Science Center.

Completed interviews were conducted in December 2013  in proportion to each state’s population and all counties within each state were represented.  Phoenix expects to repeat the survey later in the year.  Additional information is available at casinoscores@phoenixmi.com


Connecticut Ranked 45th in Population Growth Last Year; Births Outpaced Deaths, Net Loss from Migration

Connecticut’s population is estimated to have increased by 4,315 people during the past year, ranking the state 45th in the nation in population growth , according to the U.S. Census Bureau's population estimates program.

Only New Hampshire, New Mexico, Rhode Island, and Vermont added fewer residents.  Maine and West Virginia were the only states in the U.S. to lose population, by 199 and 2,376 respectively.  Connecticut’s population drop was one-tenth of one percent.

The largest overall population gain occurred in North Dakota (3.1 percent), the District of Columbia (2.1 percent), Utah (1.6 percent), Colorado and Texas (each 1.5 percent).

The data indicate that Connecticut ranked 44th in net domestic migration, losing 17,224 residents in 2013.  States losing more residents included, Ohio, Michigan, Pennsylvania, New Jersey, California, Illinois, and New York.  On the opposite end of the spectrum, the states achieving the largest net domestic migration were Texas (113,528), Florida (91,484), North Carolina (37,240), Colorado (36,284), South Carolina (29,324) aCensus Bureau Logond Arizona (26,417).

The numbers for international migration tell a different story.  California topped the list with a net gain of 123,217, followed by New York (101,778), Florida (99,454), Texas (64,187) and New Jersey (64,197).  Connecticut was just above the middle of the pack, with a net international migration gain of 15,702, ranking sixteenth.  Considering both domestic and international migration, Connecticut's net loss from migration was 2,076 people.

Connecticut saw 37,172 births and 29,249 deaths during the year, ranking the state 34th in births but 29th in the number of deaths.

The Census Bureau computes state population estimates using multiple data sets. Population estimates by state, current as of July of each year, include birth rates, death rates and estimates of residents migrating from one state to another, Governing magazine reported.

Connecticut’s population is estimated at 3,596,080, according to the U.S. Census.

Millionaires? Connecticut Ranks #3 in the Nation

If you’re looking for millionaires, you’re in the right neighborhood.  More than 6 million households in the United States have liquid assets worth more than $1 million, according to newly released estimates.  And the greatest concentrdollar signation of wealth in the United States is along the Interstate 95 corridor – including in Connecticut, which ranked #3 in the nation.

The state of Maryland has the highest percentage of millionaires in the U.S., the report by Phoenix Marketing International Global Wealth Monitor found, while New Jersey and Connecticut come in second and third.  In all three states, more than 7 percent of households have a net worth in excess of seven figures.  In Connecticut, 7.32 percent of households hold more than $1 million in assets, just behind 7.70 percent in Maryland 7.49 percent in New Jersey.

Connecticut moved up one slot, ranking fourth in last year’s survey.

Massachusetts, Virginia, New Hampshire, Delaware and the District of Columbia all landed in the top 10. Hawaii, where 7.18 percent of households hold more than $1 million in assets, and Alaska, with 6.75 percent of households, are the only two states outside the Northeast to wealthreach the top 10.

Those high-worth households control almost three-quarters of the liquid wealth in the United States, David Thompson, who rI-95uns the Phoenix Global Wealth Monitor, told the Washington Post.

States in the South make up the bulk of the bottom of the list. Fewer than 4 percent of households in Tennessee, Kentucky, West Virginia, Arkansas and Mississippi are worth $1 million or more. Just 3.76 percent of households in Idaho held more than $1 million in assets.

California ranked #11 and New York was #12.  Among the other New England states, Rhode Island was #17, Vermont #18, and Maine #25,  Maine had the second biggest jump among the states, moving up 11 places from a year ago.  North Dakota moved up 14 positions to #29.

The Global Wealth Monitor estimates the number of millionaires based on the Survey of Consumer Finance and Nielsen-Claritas data.

Connecticut Ranks #22 in Motor Vehicle Thefts; Rate Drops 3 Percent

Connecticut ranks #22 in the nation in motor vehicle thefts, with 238 thefts per 100,000 registered vehicles, a one-year drop of 3.3 percent, according to the most recent full-year data.

The District of Columbia had the greatest theft rate, with a total of 3,661 vehicles stolen and 322,350 registered vehicles in D.C.  That reflected a reduction in thefts of 18 percent in 2012 as compared with 201auto theft map
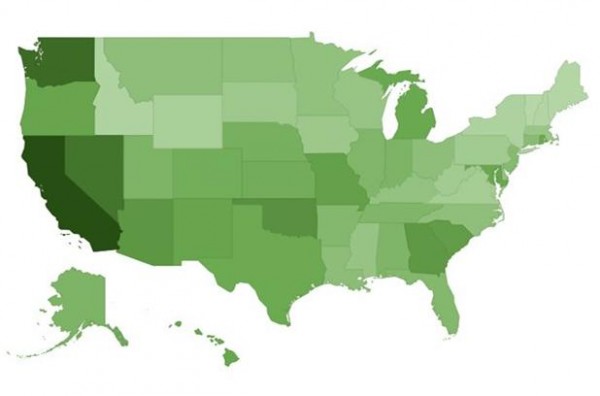
1, but still outdistanced all 50 states.

Rounding out the top 10 states with the highest rate of car thefts were California, Nevada, Washington, Maryland, Georgia, Arizona, South Carolina and Oklahoma.  Among the New England states, Rhode Island ranked #12, Massachusetts was #34, Maine was #47, New Hampshire was #49 and Vermont was #51, with 435 thefts and 606,941 registered vehicles – the lowest rate in the nation.

In Connecticut in 2012 there were 6,449 motor vehicle thefts.  The state has 2,706,459 registered vehicles.fbi-logo-large

The data was compiled by Bloomberg.com based on information from the Federal Bureau of Investigation (FBI) Uniform Crime Reports, and U.S. Department of Transportation Federal Highway Administration.

According to data compiled by the FBI and provided by the Criminal Justice Information Services Division:

  • There were an estimated 721,053 thefts of motor vehicles nationwide in 2012. The estimated rate of motor vehicle thefts was 229.7 per 100,000 inhabitants, placing Connecticut’s car theft rate  just above the national average.
  • The estimated number of motor vehicle thefts increased 0.6 percent in 2012 when compared with the 2011 estimates, but declined 24.8 percent when compared to the 2008 estimates, and 42.8 percent when compared to the 2003 estimates.
  • More than $4.3 billion was lost nationwide to motor vehicle thefts in 2012. The average dollar loss per stolen vehicle was $6,019.
  • In 2012, of all motor vehicles stolen, 73.9 percent were automobiles.

Weston, New Canaan Among Nation’s Richest Zip Codes

Weston and New Canaan are among the richest zip codes in the nation, according to an analysis by a University of Washington researcher.  Based on data from the U.S. Census Bureau’s American Community Survey, the batting order of the nation’s richest zip codes includes the two Fairfield County communities – Weston at #10 and New Canaan at #11.

zip codes
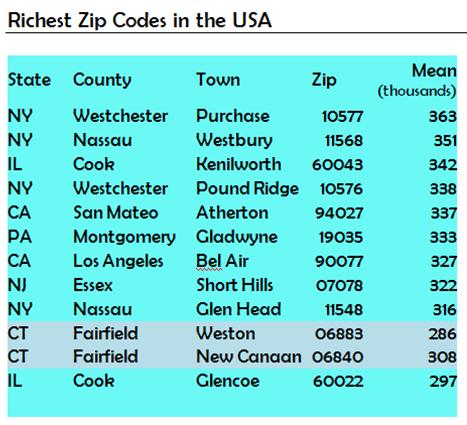
The zip code with the highest and the 4th highest incomes are in Westchester County, close to the Connecticut border. The second richest, Westbury, is in Nassau county, New York, which also has the 9th richest. Also in the New York City suburbs are the 8th, in New Jersey just 20 miles west of New York, while 10th and 11th richest are both located in Fairfield County, according to Richard Morrill, Professor Emeritus of Geography and Environmental Studies at the University of Washington, who outlined his research in newgeography.com.

The top 10 communities, by zip codes, are Purchase, N.Y.; Westbury, Long Island; Kenilworth, Illinois, Pound Ridge, N.Y., Atherton, California; Gladwyne, Pennsylvania; Bel Air, California; Short Hills, New Hersey, Glen Head, Long Island; followed by Weston and New Canaan.

“The most astounding thing about the map,” (which shows the “rich” zip codes by the county they are part of) Morrill points out, “is their  concentration  in a few areas, led by the country’s premier global city, greater New York city, with 75 of the 170.”  New York is followed by Washington DC with 23, another sign of the growing wealth of the national capital.  Boston follows with 10, Los Angeles, 18, San Francisco (14), and Chicago (6) and then a scattering in other leading metropolitan areas.

Morrill also looked at unequal income zip codes, where income disparity was most pronounced, and poor zip codes, which often included areas with a large student population, such as Storrs, which masked thrich zip codes
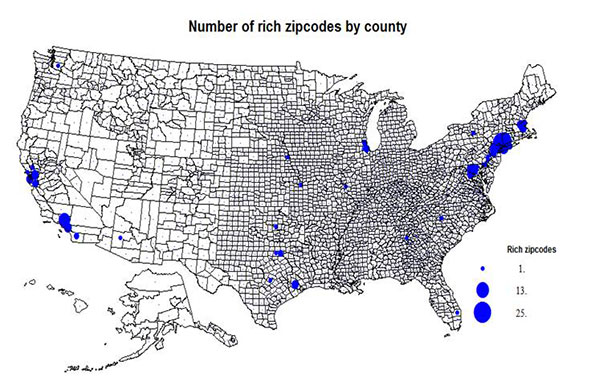
e income level of the overall population of the zip code. Among the poorest of the inner city poor areas, the data indicated, were in Los Angeles, Waterbury, CT; Portland, OR; and Youngstown and Canton, OH.

 Morrill's research focuses on political geography (voting behavior, redistricting, local governance), population/demography/settlement/migration, urban geography, and planning, and urgan transportation.  He concluded that “the zip code data provide a partial, highly localized look at the geography of inequality,” adding that “if American society continues to accept extreme income, the geography of inequality will only become not only more extreme, but more pronounced in a diverse set of locations.”

new canaan

FI-weston-sign-lamp-flag-go1-300x180

More Children in Poverty, Less State Spending For Children, Reports Reveal

The percent of children in poverty in Connecticut increased to 13.2 percent, up from 10.4 percent in the 2000 Census, according to advocacy organization Connecticut Voices for Children, which analyzed data  in the U.S. Census Bureau’s American Community Survey (ACS) covering 2008-2012.  The statewide increase in poverty among children reflects significantly increased child poverty rates in 30 cities and towns, and decreased poverty rates for children in only 12 communities.

Income disparities among Connecticut’s communities are also clearly reflected in the data.  In Hartford, for example, the percentage of children in poverty reached a state high of 45 percent and the adult poverty rate hit 33 percent, while at the other end of the spectrum, the rate in Canterbury was less than 1 percent among children and less than 3 percent among adults.

After Hartford, the percentage of children living in poverty was at its highest in the state’s urban and rural communities:  New Haven topped 37 percent, in Waterbury 34 perckidsent, New London 29 percent, Cornwall, 27 percent, Norwich 23 percent, Meriden 22 percent, East Hartford and Preston, both at 21 percent, Stamford and Kent, both at 13 percent, and Danbury 12 percent.

The following 30 towns had statistically significant increases in the percent of all children in poverty: Ansonia, Avon, Berlin, Branford, Bridgeport, Cornwall, Danbury, Darien, Derby, East Haddam, East Hartford, East Haven, Enfield, Hartford, Harwinton, Litchfield, Meriden, Middletown, New Britain, New Hartford, New Haven, Norwich, Plymouth, Preston, Stamford, Vernon, Waterbury, West Haven, Windham, and Windsor Locks.

The following 12 towns had statistically significant decreases in the percent of children in poverty: Barkhamsted, Canterbury, Columbia, Granby, Hamden, Morris, Old Lyme, Salisbury, Sharon, Thomaston, Winchester, and Woodbridge. voices logo

The percent of all Connecticut residents in poverty increased to 10.0 percent according to the ACS data, up from 7.9 percent in Census 2000 (1999 figures).  Because the ACS is based on information gathered from a sample of local residents, the "sample size" in each town can be small in any one year.  The Census Bureau, therefore, averages together five years of data to create more reliable estimates.

In another report issued early this year, it was revealed that over the past two decades, Connecticut has committed less and less of its state budget to young people, according to the Fiscal Policy Center at Connecticut Voices for Children.

The report finds that spending on the “Children’s Budget” – state government spending that directly benefits young people – has dropped from 40% of the state budget in Fiscal Year 1992 to 30% in the current budget year (FY 2014). Spending on education has fallen by about a third -- from 26% of the state budget to 19% between Fiscal Years 19American Community Survey92 and 2014. The report, “Introducing the Children’s Budget,” is available on the Connecticut Voices for Children website at www.ctvoices.org

Connecticut Voices for Children is a research-based think tank that advocates for policies that benefit the state’s children and families.  Based in New Haven, the organization advances its mission through high quality research and analysis, strategic communications, community education, and development of the next generation of advocates.

Seven Communities Earn Grants to Strengthen Downtowns

Connecticut Main Street Center (CMSC), the downtown revitalization and economic development non-profit, has selected seven organizations and municipalities to receive a total of $70,000 in  Preservation of Place grants this year.

The 2014 grants will be used to provide Connecticut communities in Bridgeport, Canton, Essex, New London, Norwalk, the Northwest corner, and Willimantic with targeted resources to increase their capacity to plan for preservation and revitalization initiatives in their downtowns and neighborhood commercial districts.

The PreserCT Main Street LOGOvation of Place grant program provides a source of funding for new initiatives that can be integrated into, and leverage, comprehensive Main Street preservation and revitalization programs. The funds are meant to be flexible to meet individual community need.

"Historic preservation and the revitalization of our Main Streets create jobs, bring vacant buildings back on the tax rolls and add value and vitality to adjacent buildings and neighborhoods," said John Simone, CMSC President & CEO. "This year's winners are taking steps to implement these types of positive changes by proactively planning for the growth and improvement of their downtowns."

The selected organizations or initiatives will receive between $5,000 and $14,500 in Preservation of Place grant funds:

  • ·         Bridgeport Downtown Special Services District, for the creation of a plan that will use open spaces to facilitate creating placemaking in downtown Bridgeport
  • ·         Town of Canton, for the development of Collinsville Village Zoning Regulations;
  • ·         Town of Essex, for a Centerbrook Visioning & Action Plan;
  • ·         New London Main Street, for an organizational and leadership development and capacity-building plan,
  • ·         Norwalk 2.0, for the Freese Park Artist Village Plan;
  • ·         Northwest CT Regional Planning Collaborative, for Active Main Street: Enlivening Village Center Public Spaces;preservation of place
  • ·         Thread City Development, Inc. (Willimantic), for an organizational and leadership development plan.

"The diversity of locations, from the Northwest Corner of Connecticut to New London, matched with the diversity of projects, from creative placemaking in urban open spaces to organizational and leadership development that will improve the management function in downtown, will allow each community to respond to their greatest current need, actively creating their direction of growth," Simone said.

Since 2008, CMSC has awarded $376,130 through the Preservation new londonof Place grant program to twenty Connecticut communities, leveraging $842,727 in local Main Street initiatives. The program receives support from the State Historic Preservation Office with funds from the Community Investment Act.

State's Public Transportation Commission Calls for Service Improvements, Safeguards to Transit Fund

With the start of the legislative session, one of the many reports landing on legislators desks include a series of six recommendations for improving public transportation services, developed by the Connecticut Public Transportation Commission and outlined in their recently released 2013 Annual Report. The recommendations, according to Chair Kevin Maloney, “do not call for any major new State-funded initiatives, though some of the recommendations would require incremental expenditures to current projects or services.”

The Commission, a 14-member advisory body comprised of gubernatorial and legislative appointees, and including members from industry and the public, developed the recommendations following seven public hearings in Norwalk, Putnam, Bristol, Orange, New Milford, Enfield and New London, and monthly meetings throughout the year.  The Commission:

1.  Strongly supports efforts to safeguard the Special Transportation Fund, stating that resources of the fund “must be reserved to address the needs of Connecticut’s roads, bridges and transit systems.”  The report noted that:

  • transfer of Fund monies to the General Fund deprives Connecticut’s infrastructure and services of these much-needed resources
  • the transfer of Fund monies violates the trust that the Special Transportation Fund’s supporting revenues and user fees will benefit the transportation services and facilities upon which those who pay the gas tax, gross receipts tax, fares and license and permit fees rely
  •  “the continued deferred investment in our transportation infrastructure that the diversion of Special Transportation Fund resources causes will erode Connecticut’s attractiveness and make it harder to compete with other states for businesses and residents”

2. Recommends sustained support for adequate for the continued operation and growth of the Coastal Link bus service, operated by Greater Bridgeport Transit, Norwalk Transit and Milford Transit along the Route 1 corridor, be provided. The line – which the report describes as “highly successful” and “perpetually in jeopardy” due to insufficient funding - carries over 4,000 passengers per weekday and over 1.2 million passengers annually, and the butransportation report
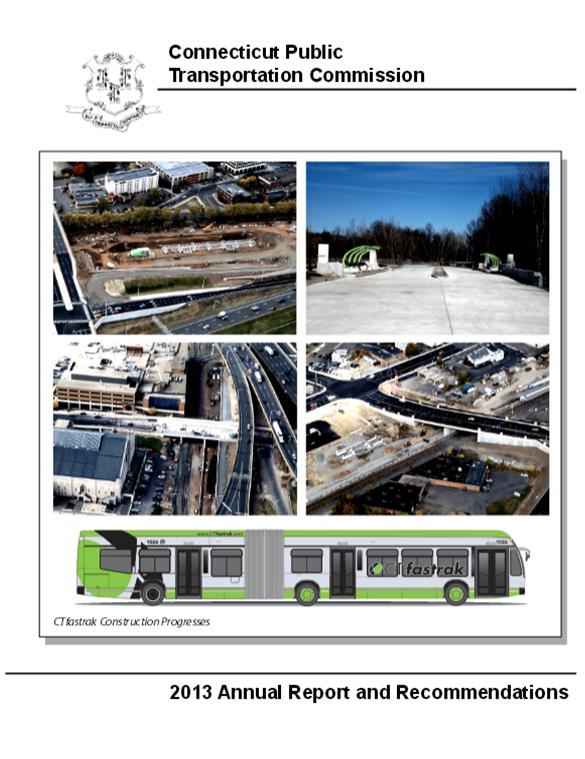
ses running this service are frequently at or above capacity with some occurrences where riders must be turned away.  “At a minimum,” the report recommends, “additional investment of state funds would be required to support additional buses to provide a consistent level of services and improve service quality.”

3. Commends ConnDOT for restoring funds to the Municipal Dial-A-Ride program – a “much needed program” that provides mobility to seniors and persons with disabilities across the state, and is “especially important to small rural communities.”  Funding had been reduced by 25 percent in 2011, which was restored in the FY2014 state budget, according to the report.  Approximately 130 municipalities apply for program funds each year.  The report notes that Connecticut is the seventh oldest state in the nation, with the over 65 population projected to grow by 64 percent by 2030. 

4. Encourages ConnDOT to apply the techniques used to inform the public about the progress and projected benefits of CT FastTrak (previously known as the Hartford-New Britain Busway) with information on other high profile projects such as the Stamford Transportation Center.   The report states that a “more vigorous and pro-active outreach effort...may pay dividends in lessening political headwinds and gain public support for these projects.”   Such actions “for other major transit projects such as the New Haven-Hartford-Springfield commuter rail service would also serve both ConnDOT’s and the public’s interests.”

5.  Urges State cooperation with an on-going effort by the Housatonic Railroad to develop a privately-run, unsubsidized passenger rail service between Danbury and Pittsfield.  With the commitment by Massachusetts of substantial funding for that state’s portion of the project, this proposal is starting to gain some momentum, the report indicates.

6.  Recommends “more effective dissemination of information about new and existing transit services,” recognizing that “the public does not have sufficient awareness of and information about existing transportation services to take full advantage of these services.”  The Commission indicated that this was a “recurring theme” at the Commission’s public hearings, and called for both high-tech and low-tech solutions.  The report noted that “addressing this need can be challenging,” because “ConnDOT has no dedicated marketing staff and no marketing budget,” and “marketing for individual services is often sporadic and inconsistent.” connecticut

Additional topics were noted in the Annual Report as a result of issues raised during public testimony, including:

  • the increasing popularity of cycling and the resulting demand for more bicycle amenities and facilities,
  • the desire of several smaller transit districts to implement designated and signed bus stops to increase system visibility and assist their riders,
  • the need for better communication on train platforms to alert riders as to which track an arriving train will be using,
  • the increasing demand for inter-regional bus services, repeated accounts of train fares going uncollected, and
  • the demand for bus and rail services which cross Connecticut’s boundaries into adjacent states.

The Commission is chaired by Kevin Maloney, President/CEO of Northeast Express Transportation, Inc. which operates NEXTAir, NEXTCourier and NEXTDistribution.  Commission members include Christopher Adams, Richard Carpenter, Morton Katz, William Kelaher, Yvonne Loteczka, Kevin Maloney, Edward McAnaney, Robert Rodman, Kiernan Ryan, Russell St. John, Richard Schreiner, Richard Sunderhauf, Alan Sylvestre, and John Zelinsky.  Among the ex-officio members are DOT Commissioner James Redeker, Sen. Andrew Maynard and Rep. Antonio Guerrera.

The Commission continues to meet monthly in accordance with state statute, with the next meeting scheduled for March 6 at New Haven’s Union Station.

Connecticut Talks Issues at Forums, Conferences Across State

The Connecticut legislature, now underway for 2014, is not the only place for conversation on key issues impacting Connecticut.  A range of news organizations, nonprofits, associations and community-based groups are sponsoring forums, summits and sessions to better-inform the public and bring interest and attention to specific issues.  Among them:

February 10  - Hartford’s Edgy Arts, Mark Twain House & Museum

The Hartford area attracts an array of creative people from actors to musicians, poets to painters.  What is it that so draws artists?  What to they need to flourish here?  A discussion of the creative economy, in the Capitol City.  Refreshments at 5:30; panel discussion at 6:15.  Advance articles published in The Hartford Courant; a program of Hartford Young Professionals & Entrepreneurs (HYPE), FOX Connecticut and The Hartford Courant.

February 20 - Pay-for-Success Informational Conference, Legislative Office Building

National leaders from the emerging field of Pay for Success will be speaking, with a focus on three key elements: 1) Offering high-quality preventative services; 2) Requiring rigorous measurement of results; and 3) Capturing savings or avoided costs. The 2014 Pay-for-Success (PFS) Informational Conference, 10:00-12:30 PM, will offer interested stakeholders the chance to discuss the field with leaders from around the country, while hearing about projects underway in the areas of early childhood, juvenile recidivism, health care and workforce development.  Sponsoring organizations include BlumShapiro, Connecticut Institute for the 21st Century, Capitol Region Council of Governments, Connecticut Center for Social Innovation, Community Impact Strategies Ltd, and Connecticut Association for Human Services.

February 24 -  The Knowledge Economy; Connecticut Conference of Independent Colleges, CT Mirror, Quinnipiac University

Connecticut is home to almost 50 colleges and universities and has created an industry in surrounding towns and cities. What is expected as we continue into the 21CCICst Century? Join the Connecticut Conference of Independent Colleges and The Connecticut Mirror in the lively discussion, "The Knowledge Economy," on Monday, Feb. 24 , from 7-9 p.m., in the auditorium at the Quinnipiac University Frank H. Netter MD School of Medicine. This event is free and open to the public. No registration is necessary.  Panelists include Sal Filardi - Vice President, Facilities & Capital Planning, Quinnipiac University; Rich Jacob - Vice President for Federal and State Relations, Yale University; Todd Andrews - Vice President for Economic & Strategic Development, Goodwin College and Jeff Seemann - Vice President for Research, UCONN.

February 26 - Vital Voices in Entrepreneurship, Goodwin College

A special speaGoodwin-College-B8665EC3ker series focused on the first-hand perspectives of leaders making a mark in business and the community. The next event at Goodwin College's Community Room on February 26 will feature Stew Leonard, Jr., President and Chief Executive Officer of the unique, family-owned and operated farm fresh stores, Stew Leonard's. The keynote address will commence at 6:00 p.m., preceded by a networking reception at 5:00 p.m. with wine, beer and hors d'oeuvres.

February 28 – Retrofitting Our Towns:  Can We Add Density, Affordability and Walk-ability to Help Municipalities Survive…And TPrinthrive?  The Lyceum, Hartford

Can suburbs and smaller towns reshape and respond to the demographic, economic and lifestyle pressures of the 21st Century?  One of the nation’s leading experts – Lynn Richards of the EPA Office of Smart Growth – assesses four Connecticut municipalities and offers lessons for all the others.  Program 9:00-111:00 AM.  Sponsored by the Connecticut Main Street Center, Partnership for Strong Communities and the American Planning Association - Connecticut.

March  Ct-forum7  - An Honest Look at Mental Illness, Connecticut Forum, The Bushnell

The Connecticut Forum presents a conversation about perceptions, realities, and what it’s like to work and live with the stigma of mental illness.  Panelists include journalist and mental health advocate Andrew Solomon, Dr. Hank Schwartz, Chief of Psychiatry at Hartford’s Institute of Living, former NBA player Royce White and bipolar disorder authority Dr. Kay Redfield Jamison.   Founded in 1992, The Connecticut Forum is a one-of-a-kind 501(c)(3) nonprofit organization serving Connecticut and beyond with live, unscripted panel discussions among renowned experts and celebrities, and community outreach programs including the award-winning Connecticut Youth Forum.

March 14 – Hartford Business Journal Municipal Collaboration Summit, Goodwin College

An opportunHBJity to learn about the benefits of collaboration which save money and leverage the purchases and agreements for towns.  The event will highlight people that are already implementing positive changes.   Panel discussions, workshops and Q&A with key leaders and a panel of experts.

March 26 - Student Debt and Financial Aid: What (if anything) can we do?, Southern Connecticut State University

Sponsored by the Center for Higher Education Retention Excellence, 9AM-3PM, at Southern Connecticut State University, featuring Sandy Baum, Research Professor of Education at the George Washington School of Education and Human Development and Senior Fellow at the Urban Institute, and  panel of Connecticut financial aid directors (representing a public university, community college and private college) and a student panel.  Registration now available; limit 75 attendees.