Hartford’s Health & Fitness Ranks #12 Among Nation’s Top 50 Metro Regions

Apparently, Hartford is in better shape than many of us may have thought. In fact, a national analysis by the American College of Sports Medicine (ACSM), with support from the Anthem Blue Cross and Blue Shield Foundation, ranks the metropolitan statistical area (MSA) of Hartford-West Hartford-East Hartford as 12th in the nation in the annual American Fitness Index™ (AFI) report. The 2014 AFI data report, “Health and Community Fitness Status of the 50 Largest Metropolitan Areas,” reflects a composite of preventive health behaviors, levels of chronic disease conditions, and community resources and policies that support physical activity.

In the 2014 report metropolitan Hartford received a score of 63.8 (out of 100 possible points) to earn the overall #12 ranking. Hartford ranked #7 in Community Health and #17 in Personal Health, according to the data analysis.logo

Leading thwalkinge rankings is the Washington, D.C., metro area with a score of 77.3, followed by Minneapolis-St. Paul, Portland, Denver, San Francisco, San Jose, Seattle, San Diego, Boston Sacramento and Salt Lake City.

Researchers analyzed the data from the U.S. Census, the U.S. Centers for Disease Control and Prevention’s Behavioral Risk Factor Surveillance System (BRFSS), The Trust for the Public Land City Park Facts and other existing research data in order to give a scientific, accurate snapshot of the health and fitness status at a metropolitan level.

The data regarding Hartford-Westfitness chart 
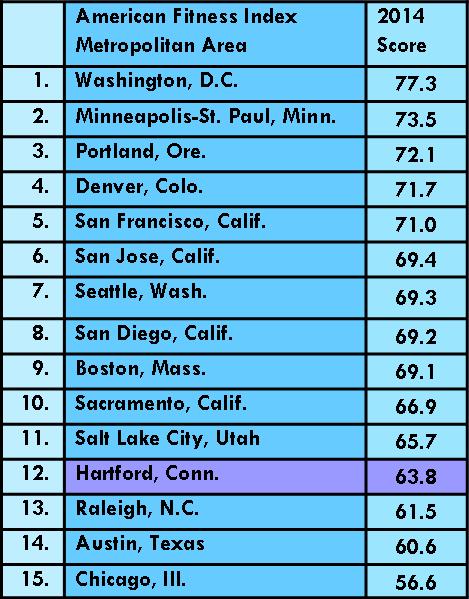
Hartford-East Hartford indicate that 78 percent engaged in physical activity or exercise within the past 30 days, 35 percent eat two pieces of fruit per day, and 14 percent eat 3 or more vegetables per day. Just over 15 percent of the population are smokers. Overall, 60 percent are described as being in “excellent or very good health,” although 36 percent indicate they had days when their “mental health was not good” during the past month.

Among the “areas of excellence” cited for Hartford-West Hartford-East Hartford are a higher percent bicycling or walking to work, more farmers’ markets per capita, more golf courses and tennis courts per capita and a higher percent eating two or more fruits per day.

ACSM worked with the Indiana University School of Family Medicine and a panel of 26 health and physical activity experts on the methodology of the AFI data report. The 2014 edition uses revised methods from the first six full-edition reports released from 2008 to 2013.

New variables, including each community’s Walk Score ranking, have been added or modified and some variables have been removed to improve and enhance the 2014 data report.

“The AFI data report is a snapshot of the state of health in the community and an evaluation of the infrastructure, community assets and policies that encourage healthy and fit lifestyles. These measures directly affect quality of life in our country’s urban areas,” said Walter Thompson, Ph.D., FACSM, chair of the AFI Advisory Board.

The American College of Sports Medicine is the largest sports medicine and exercise science organization in the world. More than 50,000 international, national and regional members are dedicated to advancing and integrating scientific research to provide educational and practical applications of exercise science and sports medicine.

Higher Percentage of Part-time Workers in CT Than New York, New Jersey, Lower Than New England

Connecticut's percentage of part-time workers (22.2 percent) outpaces much of the Northeast, South, Midwest and West, according to the latest Connecticut Economic Digest (CED), produced by the state Department of Labor and Department of Economic and Community Development. In the first examination of part-time employment in more than a decade, the publication noted that part-time employment in Connecticut numbered 383,000 - 69.5 percent of which (266,000) was women. This statewide share is among the highest in the country, which had a 50-state average of 64 percent.

part time chartConnecticut’s part-time employment share of 22.2 percent is the lowest in New England but considerably greater than neighboring states in the tri-state area, which have employment shares respectively of 17.6 percent (New York) and 17.9 percent (New Jersey), the analysis by the state Department of Labor indicated.

Part-time employment is all employment that amounts to less than 35 hours per week. Since 1997 it has averaged about 20 percent of total employment in Connecticut and fell to 18.6 percent in 2000, according to the CED, before climbing.

In recent years it has gradually trended upward and was 22.2 percent of employment in 2012, the most recent year of annual average datCED
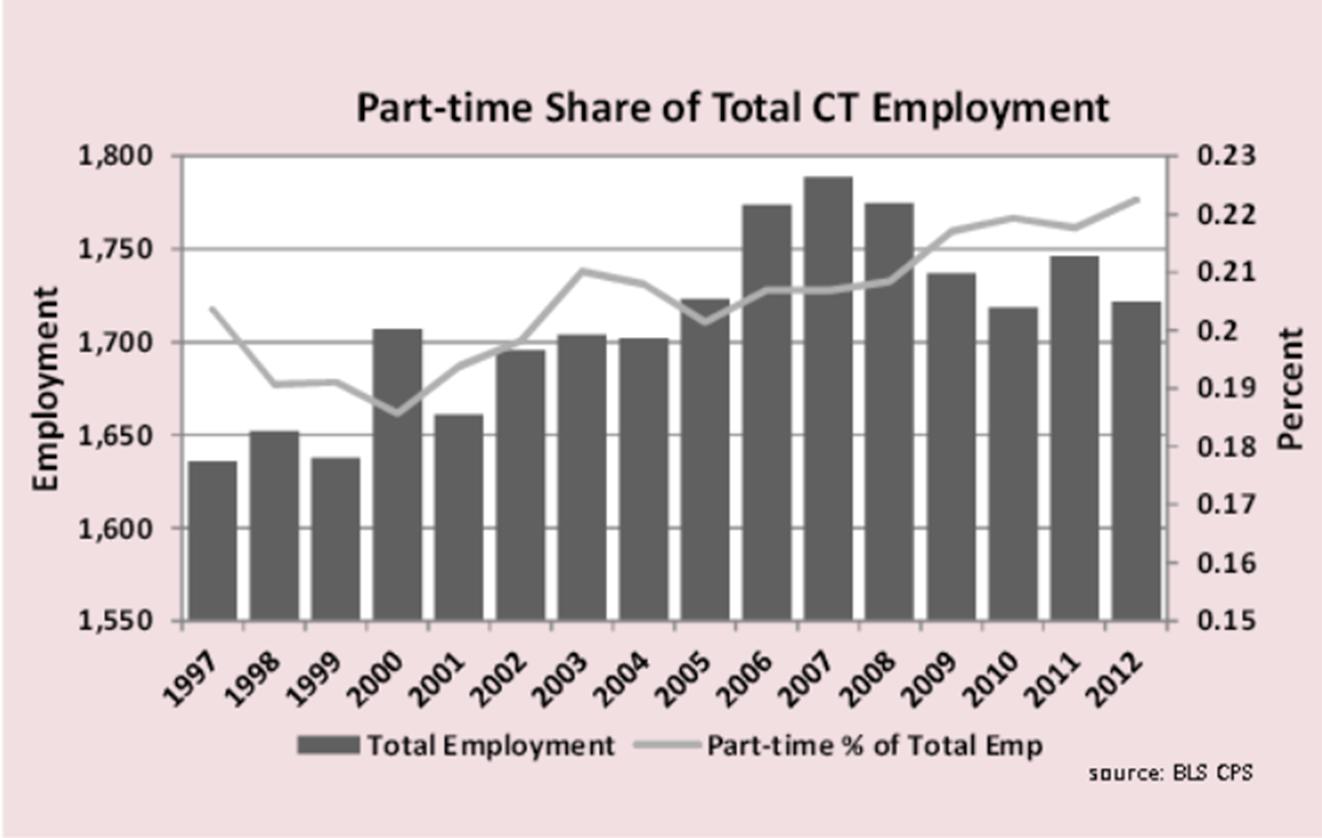
a and the basis for the analysis. The breakdown of hours worked shows that Connecticut has less under 35 hours per week employment than other New England states but more than the Northeast region overall. Part-time employment was 23.3% of all New England employment in 2012, higher than any other census division in the country. The other eight census divisions averaged 19.3% with the West- South Central division lowest at 16.4%.

While those choosing to work part time remain the bulk of part-time workers, the number of those working less than full time has grown since 2005 as more workers have their hours cut by employers or were unable to find full-time jobs during or after the recession. From 2009 to 2011, the number of workers who wanted full-time employment but could only find part-time jobs rose 37.5 percent to 33,000 from 24,000, Hartford Business Journal reported. part time 2

The report points out, however, that a majority of part-time employment in Connecticut is due to voluntary reasons, and not a result of prevailing economic conditions. In 2012, voluntary part-time employment in Connecticut was 76.4 percent of all part-time employment, in line with the 50-state average of 76.8 percent.

The industries with the lowest average weekly hours worked are leisure and hospitality, other services, and education and health services. In 2013, these industries averaged 25.8, 30.9, and 31.2 work hours per week, according to the Connecticut Economic Digest report issued in May.


Noah, Liam, Sophia, Emma Are Top Baby Names Nationally, In Connecticut It’s William and Olivia

There are trends in names given to new born babies, and then there’s Connecticut. The Social Security Administration has released the top baby names by state for 2013, state-by-state. Emma remains the top girls' name, claiming the number one spot in 27 states. Liam, the top boys' name in 18 states, replaces last year's top state name, Mason.

babies
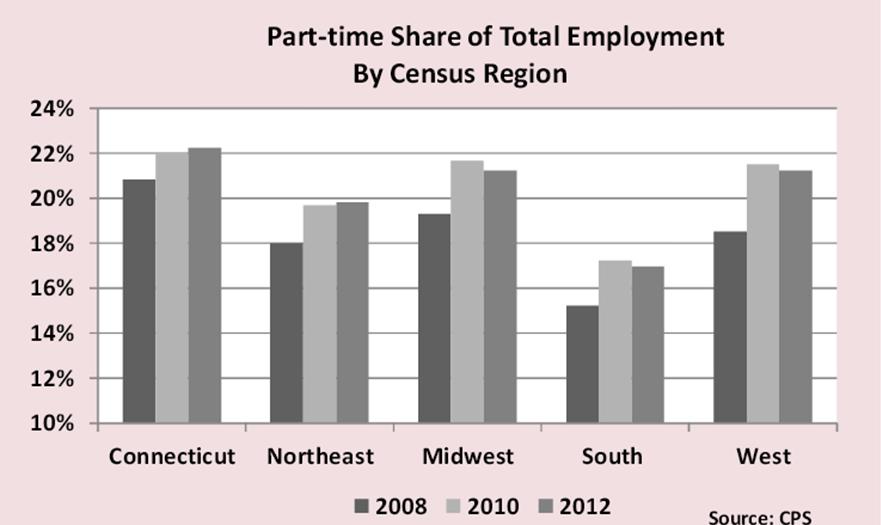
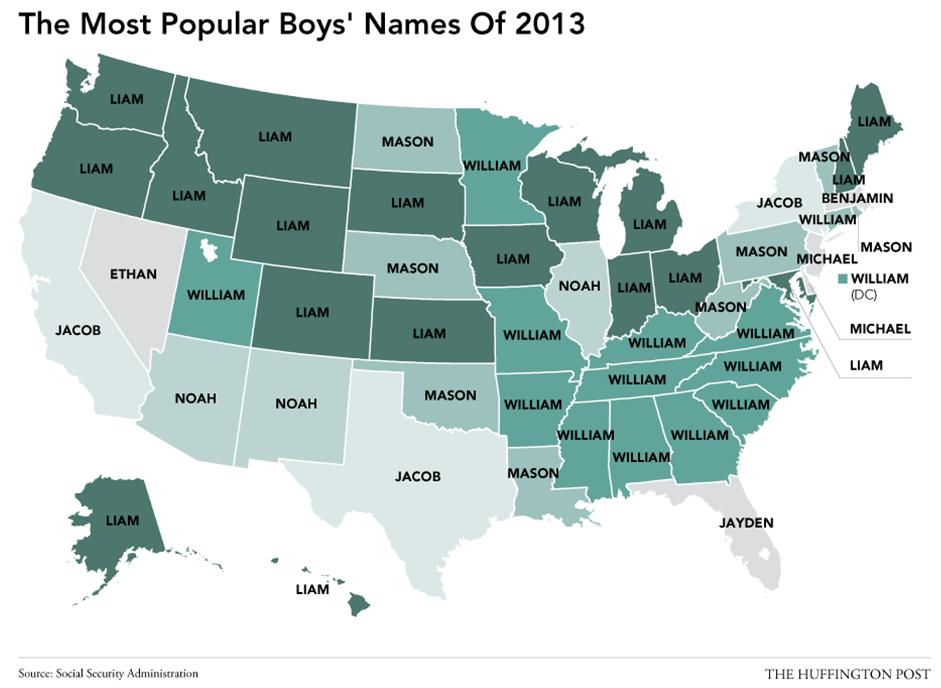
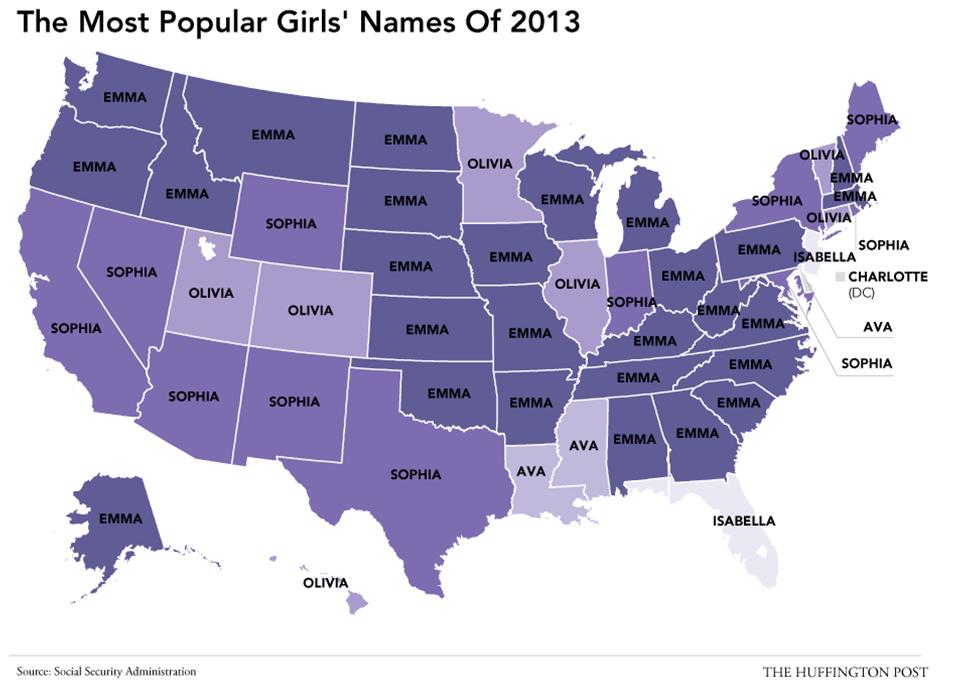
The top names by state differ from the top national names overall, where Sophia and Noah take the top spots. For the first time since 1960, a new name unseated Michael or Jacob as the most popular for newborn boys, according to the Social Security Administration, which releases each year. Topping the list in 2013 was Noah. Among new born girls, Sophia held the top spot for the third year in a row.

In Connecticut, Olivia and William topped the list. Among girls names in Connecticut in 2013, the top five were: 1) Olivia, 235; 2) Isabella, 230; 3) Emma, 212; 4) Sophia, 210; and 5) Ava 188.

Olivia was also the top ranked girls name in Colorado, Hawaii, Illinois, Minnesota, Utah and Vermont. Nearly every state in the nation was led by either Emma, Sophia, Olivia. Ava was the most favored girls name in three states: Louisiana, Delaware, and Mississippi. Only New Jersey, where Isabella topped Sophia, 618 to 607, Florida, where Isabella edged Sophia by 1,455 to 1,382, and the District of Columbia had a different girls name leading the list – Charlotte edged out Sofia in D.C., 53 to 48.top 5 2

Among boys named in Connecticut in 2013, the leaders were: 1) William, 207; 2) Mason, 198; 3) Jacob, 193; 4) Noah, 192; 5) Michael, 187.

William was also the top ranked boys name in 13 other states, including Alabama, Arkansas, Georgia, Kentucky and Minnesota. The top boys name in Massachusetts was Benjamin, the only state in the nation where it ranked first. Among the 50 states and D.C., the top ranked boys names included William, Mason, Jacob, Liam, Noah, Ethan (only in Nevada), and Jayden (only in Florida).

Nationally, the Top 10 names for boys were Noah, Liam, Jacob, Mason, William, Ethan, Michael, Alexander, Jayden and Daniel. The top names for girls were Sophia, Emma, Olivia, Isabella, Ava, Mia, Emily, Abigail, Madison and Elizabeth.


boys names mapgirls names map

More Bicycling, Walking to Work; New Haven Leads the Way in Connecticut

Connecticut has the smallest percentage of people walking to work among states in the Northeast, and is one of two states with the smallest percentage of people who bicycle to work, according to newly released U.S. Census data.  Nationwide, both walking and bicycling to work are on the rise. Between 2000 and 2008–2012, the number of workers in the U.S. who traveled to work by bicycle increased by 60.8 percent, from about 488,000 in 2000 to about 786,000. This increase in the number of bicycle commuters exceeded the percentage increase of all other travel modes during that period, but the overall share of workers who commute bnew haven
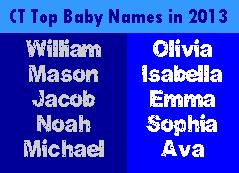
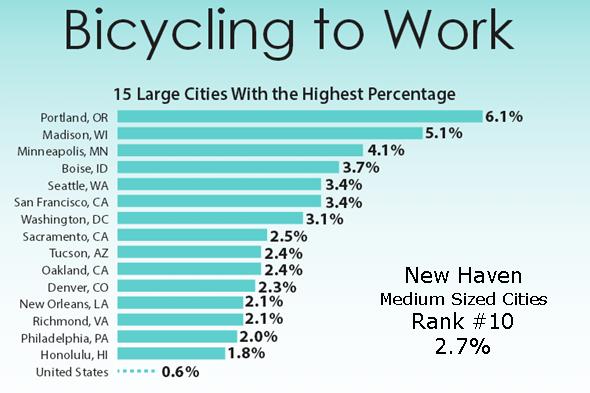
y bicycle remains low, according to the U.S. Census American Community Survey. In 1980, 0.5 percent of workers commuted by bicycle. This rate dropped to 0.4 percent in 1990, where it remained in 2000, before nudging upward in the latest survey.

The 2008–2012 5-year data show that, among the approximately 140 million workers in the United States during that period, 2.8 percent walked to work and 0.6 percent commuted by bicycle, compared with 86.2 percent of workers who drove alone or carpooled to work.

walk toAmong the nation’s medium sized-cities, (with pbike to workopulations between 100,000 and 199,999) New Haven ranks at #5 with 12.4 percent walking to work and at #10 with 2.7 percent of the population using bicycles to get to work. Hartford ranks at #10 among the top walk-to-work medium sized cities with 8.2 percent, and did not reach the top 15 in bicyclists.

The top medium-sized cities for percent of the population walking to work were Cambridge, Berkley, Ann Arbor, and Provo, just ahead of New Haven. The top bicycle-to-work medium sized cities were Boulder, Eugene, Berkeley, Cambridge, and Fort Collins.

The nation’s #1 walk-to-work city is Boston (15.1 percent) followed by Washington, Pittsburgh, New York, San Francisco and Madison. For bicycling to work, the top cities are Portland (6.1 percent), Madison, Minneapolis, Boise and Seattle.

The nationwide data indicates that:

  • The combined rate of bicycle commuting for the 50 largest U.S. cities increased from 0.6 percent in 2000 to 1.0 percent in 2008–2012.
  • The Northeast showed the highest rate of walking to work at 4.7 percent of workers, while the West had the highest rate of biking to work at 1.1 percent. The South had the lowest rate of biking and walking to work.
  • Younger workers, those aged 16 to 24, had the highest rate of walking to work at 6.8 percent.
  • At 0.8 percent, the rate of bicycle commuting for men was more than double that of women at 0.3 percent.

The percentage of workers age 16 and over who carpool to work is below 10 percent in each of Connecticut’s eight counties, with the exception of Windham County, at 10.5 percent.

Fairfield County has longest commute, most use of mass transit

The walk to work
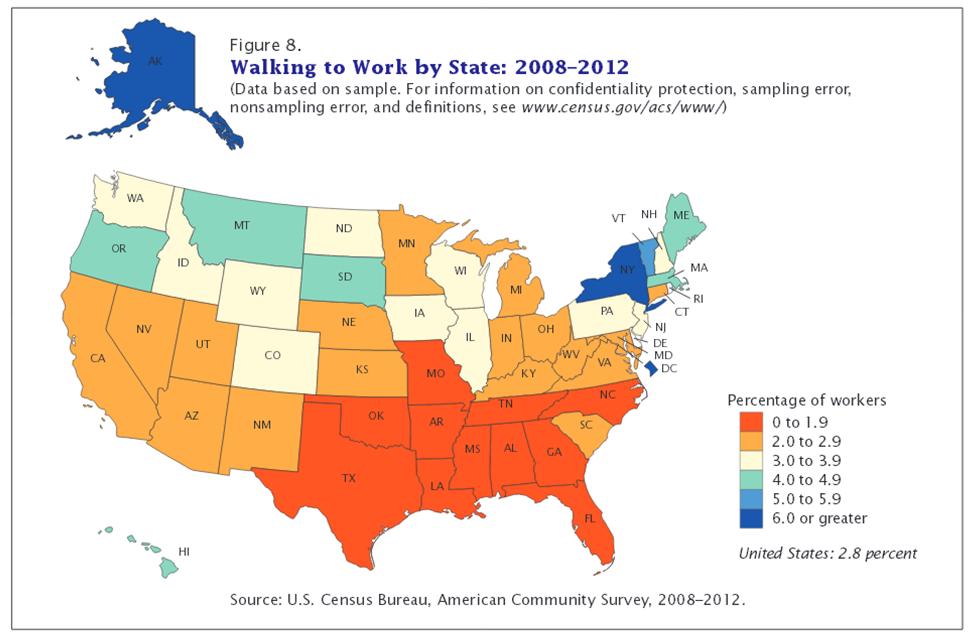
average commute to work in Connecticut is about 25 minutes, ranging from 28 minutes in Fairfield County, 27 minutes in Litchfield County, 26 minutes in Windham County, 25 minutes in Middlesex County and Tolland County, to 24 minutes in New Haven County, 23 minutes in New London County, and 22 minutes in Hartford County.

The highest percentage of workers using public transportation to reach their place of employment each day is in Fairfield County, at 8.9 percent, more than double the percentage of the next highest county, New Haven County, at 4.1 percent.

The Census Bureau released a new commuting edition of the interactive map Census Explorer, which gives Web visitors easy click-and-zoom access to commuting statistics for every neighborhood in the U.S. It also shows how commuting has changed since 1990 at the neighborhood, county and state level — including how long it takes to get to work, commutes longer than an hour, and number of bikers. It uses statistics from the American Community Survey, the national source of commuting statistics down to the neighborhood level.

Growing Aging Population Brings Shifting Priorities, Possibilities

“Given the gift of longer life, better health, greater engagement and more possibilities, the fifty-plus generation of today holds new and very different ideals,” A. Barry Rand, CEO of AARP, told a  national AARP convention audience in Boston last week that included more than 250 people from Connecticut. “The old story of aging was about freedom from work. The new story is about freedom to do something different,” he said of what was described as “The Age of Possibilities- America’s second aging revolution.”

With one of the nation’s largest populations of older citizens on a percentage basis, the changes ring especially true in Connecticut. Past U.S. Census data, for example, indicates that Connecticut has consistently ranked in new-aarp-logo---resized-800x600the top tier of states in the percentage of residents age 65 and older, and as high as 5th (2010 census) in the percentage of population age 85 and olderThe Connecticut Post reported back in 2010 that Connecticut,  in less than a decade, moved from 15th in state rankings by the U.S. Census Bureau of people 65 years old and over to ninth-place -- seventh if those 60 and over are counted.

Between 2000 and 2010, Connecticut’s 65 and older population grew by 7.7 percent and the states’ 85 and older population grew by 32.1 percent, according to the U.S. Census.   Rand cited a series of national statistics that not only underscored his premise, but reflect that the demographic shift is already underway. Rand noted:

  • Most people turning 50 today can expect to live another 30-plus years.
  • They have over half their adult lives ahead of them. That’s more time than they spent in childhood, in adolescence, and for many, it’s more time than they spent working.
  • By 2030, one in every three Americans will have reached the age of 50.
  • At the same time, 10,000 people a day are turning 65 — and that will continue for the next 17 years.
  • The fastest growing age group consists of people 85-plus.
  • We’re quickly approaching a time when people 65 and older will outnumber children 15 and under for the first time in history.

“This reflects a monumental change in our social structure and how we live our lives,” Rand said.  AARP officials said that in Connecticut over the next 15 years (2010 to 2025), the total population is projected to grow by 275,254, an increase of eight percent. When looked at by age group, however, more distinct differences emerge:

  • The percentage of individuals under age 18 will decrease by 11 percent.
  • The percent of adults between the ages of 18 and 64 will only increase by three percent.
  • In contrast, the percent of individuals age 65 and over will increase substantially, by 63 percent, due to the aging of the Baby Boom generation.

The Populations Reference Bureau reports that projections of the entire older population (which includes the pre-baby-boom cohorts born before 1946) suggest that 71.4 million people will be age 65 or older in 2029.

In Connecticut, when the state Department on Aging was established last year, officials indicated that the 65 and older population made up 14 percent of the state's population and was expected to grow to 21.5 percent of the population by 2030.


Who Knew? Northeast is Hotbed of Entrepreneurial Activity, For Some More than Others

Takes one to know one. Or, more accurately, know one and you may become one. That’s the bottom line of an exploration into entrepreneurship by a Kauffman Foundation researcher, who found that the Northeast is the best place to catch the entrepreneurial bug. As Connecticut sinks increasing dollars into initiatives to encourage entrepreneurship, develop jobs, and turn ideas into businessentrepreneurses (often with state financial incentives) the report offers guidance of factors influencing the frequency of entrepreneurial launches.  Connecticut Innovations,  established and supported by state government,  helps Connecticut businesses grow through creative financing and strategic assistance,  and is the nation's sixth most-active early stage investor.

The survey indicated that the likelihood of a person knowing entrepreneurs varied widely by location, income, gender, and age. Respondents were much more likely to know entrepreneurs if they were male, had modest income, or were middle-aged. And they were much less likely to know entrepreneurs (or be entrepreneurs) if they were female, had a higher income, or were located in the Midwest or South.

The study suggests that there could be “material increases in entrepreneurship simply through doing a better job of exposing people to existing entrepreneurs, especially peers or contemporaries.” Entrepreneurship grows, the study found, where it is planted.

Key factors to consider when attempting to encourage entrepreneurship, according to the study:

  • Women have less exposure to growth entrepreneurs than men
  • The young have much more exposure to growth entrepreneurs
  • People in lower income strata are much less likely to be exposed to growth entrepreneurs

The study concluded that “In all cases, an individual’s exposure to entrepreneurs—and to growth entrepreneurs in particular—may increase his or her likelihood of being one. Entrepreneurship can be viral, but must be introduced early and often in environments where it is least often seen.”

The study distinguished between entrepreneurial companies and “growth entrepreneurial companies,” those companies growing more than 20 percent a year and with more than $1 million in sales, generate more employment and contribute more to wealth and GDP than do slower-growing ventures.

The likelihood of a respondent reporting knowing an entrepreneur by Region 
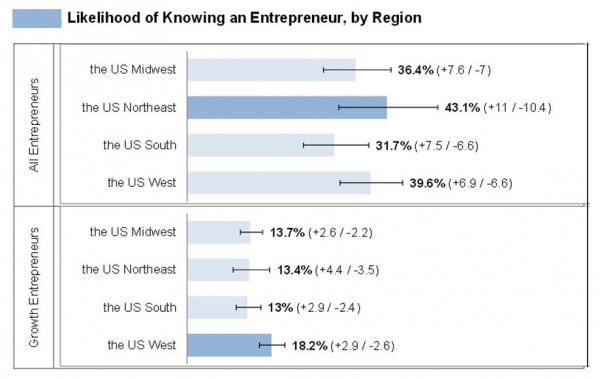
in the United States was 36.7 percent. The likelihood of knowing a growth entrepreneur was considerably lower, at 15.4 percent.

When broken down by gender, the likelihood of males knowing an entrepreneur was 39.9 percent, females 35.8 percent. For growth entrepreneurs, the gender gap was considerably wide, 24.8 percent to 12.1 percent.

A year ago, CTNext, Connecticut’s innovation ecosystem managed by Connecticut Innovations (CI), announced the launch of the Entrepreneur Innovation Awards (EIA), a competitive pitch process that provides awards up to $10,000 to entrepreneurs in Connecticut for growth-related activities. CI helps innovative companies in four key ways: by offering equity, debt, grants and strategic guidance.

A month ago CTNext announced the winners of the latest round of EIA awards; Connecticut-based companies and entrepreneurs, received $10,000 for their project ideas. CI also selected David Wurzer, formerly a senior managing director at CI, to be chief investment officer and executive vice president. As part of his new role, Wurzer will be responsible for the management of the investment function, staffing needs, portfolio and risk management, outreach to stakeholders, budget planning and performance measurement.

The study “Getting the Bug: Is (Growth) Entrepreneurship Contagious?” was conducted by Paul Kedrosky of the Kansas City-based Kauffman Foundation, and is aimed at providing data to guide efforts across the country to grow entrepreneurship. The survey, which categorizes responses of 2,000 individuals by age, income, gender, and location, was done via Consumer Google Survey.

Tolland County is Healthiest in Connecticut, Fairfield Next, Report Finds

The healthiest county in Connecticut is Tolland County, according to a new report analyzing health data from nearly every county in the country. The 2014 County Health Rankings & Roadmaps ranked Connecticut’s eight counties by health outcomes and health factors. According to the report, health outcomes represent how healthy a county is while health factors represent what influences the health of the county.

county_health_ranking_300In health outcomes, Tolland County led the way, followed by 2)Fairfield County, 3)Middlesex County, 4)Litchfield County, 5)New London County, 6)Hartford County, 7)Windham County and 8)
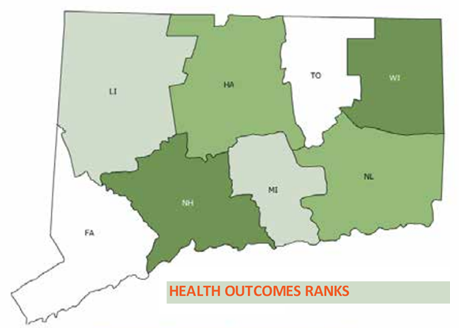
health outcome ranksNew Haven County.

In health factors, Middlesex County ranked first, followed by Tolland County, Fairfield County, Litchfield County, New London County, Hartford County, New Haven County and Windham County.

The County Health Rankings & Roadmaps program helps communities identify and implement solutions that make it easier for people to be healthy in their schools, workplaces and neighborhoods, according to study authors. The Robert Wood Johnson Foundation collaborated with the University of Wisconsin Population Health Institute on the state-by-state analysis and report, which measured the health of nearly every county in the nation.

The report website includes “county snapshots” - detailed data for each county, in each of the health factors and health outcomes. Comparisons between counties, and the statewide numbers, are also available.ranks

Health factors data included in the analysis are health behaviors, such as tobacco use, diet and exercise, and alcohol and drug abuse; clinical care, including access to care and quality of care; social and economic factors, including education, employment, income, safety and family support; and physical environment, including air and water quality, housing and transit. Health outcomes date included length of life, and quality of life, with factors such as physical health and mental health.

The report website provides specific data in each of the categories, and ranks Connecticut’s eight counties in each factor. This year’s Rankings release marked the fifth anniversary of the first national release of the County Health Rankings.

Hartford Ranked #35, New Haven #39 in Income Inequality Among US Cities; Bridgeport-Stamford-Norwalk Is Nation's Most Disparate Region

A new analysis ranking the cities with the greatest income inequality includes Hartford and New Haven in the top 50.– and the Bridgeport-Stamford-Norwalk metropolitan area is the metro region with the largest income disparity in the nation.

The major cities with the most dramatic income inequality in their population are, ranked in order:  Atlanta, New Orleans, Miami, Jackson (Mississippi), Gainesville (Florida), Tampa, Cincinnati, Athens (Georgia), Providence, Berkeley and Boston.  Seven of the top 11 are cities in the Southern U.S.

Among New England cities, Providence ranked #9, Boston at #11, Cambridge at #12, Hartford at #35, and New Haven at #39.  Among other major cities, New York ranked #13 and Washington, D.C. ranked #15.

Bloomberg ranked 300 U.S. cities with populations of at least 100,000income-inequality-shutterstock_146836310 
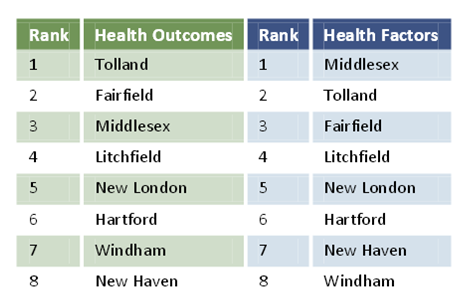
based on their level of income inequality and identified the 50 with the greatest inequality. The media outlet also ranked the top 20 metropolitan areas with the greatest income disparity.

On that list, Bridgeport-Stamford-Norwalk ranked as the metro area with the most income inequality in the nation.  Among the 20 regions with the greatest disparity, one-quarter are in Florida – including Naples-Marco Island at #2 and Gainesville at #3.  College-Station-Bryan (Texas) was #5 and New York-Northern New Jersey was #5 on the list of metro areas. 

They methodology for the analysis was use of the “Gini coefficient,” which is calculated by the U.S. Census from household income share by quintiles, used to measure distribution of wealth. It ranges from zero, which reflects absolute equality, to one, complete inequality.

Hartford’s Gini coefficient was 0.5176, New Haven’s was 0.5144.  By comparison, Atlanta’s was 0.5882, and Providence 0.5445.  New Haven’s income inequality improved slightly, by 5.4 percent, since 2008, while Hartford’s disparity grew slightly, by just over 1 percent, according to the data.

The Bridgeport-Stamford-Norwalk region had a Gini coefficient of 0.5459.

It was reported that in New Haven, 26.1 percent of the population was living in poverty; in Hartford the figure was 38 percent.  In Hartford, 54 percent of household income was in the highest quintile, while 2 percent was in the lowest quintile.  In New Haven, 38 percent was in the highest quintile while 2.5 percent placed in the lowest.

In the ranking of the 50 cities with the most income inequality, Hartford was between Lafayette, Louisiana and Cleveland, OH.  New Haven ranked between Charleston, S.C. and Tulsa, OK on the list.

The average score for the United States was 0.4757. In 2013, a person living alone making less than $11,490 was classified as in poverty. The threshold increased by $4,020 for each additional household member, Bloomberg reported.

Encore Entrepreneurs – Over 50 and Building New Businesses

Mix a relatively slow economy and a shortage of jobs with a large number of aging boomers looking for meaning and purpose in their work. The result is a growing number of “encore entrepreneurs” seeking to launch income-generating ventures that make a positive difference in their communities.

That has led the U.S. Small Business Administration (SBA) and AARP to launching a strategic alliance to provide counseling and training to entrepreneurs over the age of 50 who want to start or grow a small business.   AARP

April is Encore Entrepreneur Mentor Month, and would-be “encore entrepreneurs” will have the opportunity to connect with a number of organizations and community leaders for advice and assistance in their endeavors as part of seminars held as part of the AARP-SBA initiative.

Next up in Connecticut:  a free seminar, Want to Start or Grow a Small Business?, at the Hartford Public Library on Wednesday, April 23, 2-4 PM, at 500 Main Street.  Space is limited. Interested individuals can register online or call toll-free 877-926-8300.   There will also be a session in New Haven on May 15.

For many Americans born between 1946 and 1964, retirement has a very different meaning than it did a generation ago.   According to a USA Today/Gallup poll, 63% of American adults plan to work in retirement; two-thirds say enjoyment of work is the key reason. With years of valuable work experience, maturity, and plenty of energy at their disposal, today's older workers are increasingly finding financial and personal fulfillment in running their own small businesses.entrepreneur

New research released by Encore.org (formerly Civic Ventures) and funded by the MetLife Foundation shows:sba-logo-300x121

  • Approximately 25 million people – one in four Americans ages 44 to 70 – are interested in starting businesses or nonprofit ventures in the next five to 10 years.
  • More than 12 million of these aspiring entrepreneurs are potential encore entrepreneurs who want to make a positive social impact as well as a living.  Potential encore entrepreneurs have realistic financial expectations and plan local, small ventures to meet needs in their communities.
  • These aspiring entrepreneurs bring a lot of experience to the table, including an average of 31 years of work experience and 12 years of community involvement. Additionally, five out of six report having management experience – 15 years on average.

A 2010 survey by the Kauffman Foundation found that Americans 55 to 64 start new business ventures at a higher rate than any other age group, including 20-somethings. Fully 23 percent of new entrepreneurs were age 55 to 64, up from 14 percent in 1996.

The first event in Connecticut was held in Bridgeport in late January, followed by Danbury in early April.  An additional program is slated for New Haven on May 15 (2 to 4 PM) at Gateway Community College.

In Search of Adventure: A Children’s Book Diversity Mystery

In 2012, 93 percent of children’s books written that year were written about white characters, according to a study by the Cooperative Children’s Book Center.  There were 3,600 children’s books written that year.

Apparently the hue and cry were insufficient to change the inertia of insensitivity to the range of skin colors on American children.  A similar study in 2013, recently highlighted in The New York Times, found the following:  of 3,200 children’s books published last year, just 93 were about black people and 57 were about Latinos.  The Cooperative Children’s Book Center is at the University of Wisconsin. PowerpointGraphic1

A well-circulated illustration by Tina Kugler, spurred by the 2012 numbers, highlighted them:

  •   3% were about Africans/African Americans; 1.8% were written by Africans/African Americans
  •   1.5% were about Latinos; 1.6% were written by Latinos
  •   Less than 1% were about American Indians; less than 1% were written by American Indians
  •   2% were about Asian Pacifics/Asian Pacific Americans; 2.3% were written by Asian Pacifics/Asian Pacific Americans

Back in 2008, a study by Brigham Young University found that “characters depicted in Newbery winners are more likely to be white, male and come from two-parent households than the average U.S. child,” according to published reports.  The Newberry Award is the annual top honor for children’s literature.

At the time, Bloomberg News reported the following:  The Chicago-based American Library Association has awarded the Newbery Medal to one book annually since 1922. All Newbery books remain in print, underscoring their enduring nature. Their popularity with teachers and parents means that for many younger children, Newbery medalists are a primary way they learn about the world and how to relate to others.

Writing in The New York Times, author and illustrator Christopher Myers pointed out last month that children “are much more outward looking.  They see books less as mirrors and more as maps.  They are indeed searching for their place in the world, but they are also deciding where they want to go.  They create, through the stories they’re given, an atlas of their world, of their relationships to others, of their possible destinations. … Children of color remain outside the boundaries of imagination.  The cartography we create with this literature is flawed.”

The National Education Association has added to its website “50 Multicultural books every child should read.”  The most recent title, for children from preschool to age 12, was written in 2009.diversity_tinakugler

Locally, Eastern Connecticut State University associate professor of English Dr. Raouf Mama is recipient of the 2008 National Multicultural Children's Book Award from the National Association of Multicultural Education.  The author of children’s books and master storyteller, a native of Benin, Dr. Mama performs African and multicultural stories, blending storytelling with poetry, song, music, and dance.   An orator out of the African oral tradition, he also lectures on African literature and African folklore and conducts workshops on storytelling and creative writing, and the power of folktales as multicultural teaching and learning tools, especially as tools for teaching literacy skills, creative writing, and public speaking.

When the American Association of School Librarians had their National Conference & Exhibition in Hartford last fall, the issue was on the agenda.  One of the conference session’s dealt specifically with multicultural children’s literature.  Led by acclaimed children’s book author Kelly Starling-Lyons and author Gwendolyn Hooks, the session was directed to “school librarians who want to build or expand their collections with multicultural titles.”

Conference attendees from across the country who were attending the biannual event were “invited to come celebrate a showcase of great books by African American children's book creators.”  Hooks and Starling Lyons saluted titles that have been featured on The Brown Bookshelf blog.

The conference theme during those November days in Hartford:  Rising to the Challenge.

image_race