At the start of this week, Westport-based Connoisseur Media became the new owners of Connecticut’s oldest radio station, WDRC, owned for the past half-century by Buckley Broadcasting. The sale also included Buckley Connecticut stations WMMW AM in Meriden, WWCO AM in Waterbury and WSNG AM in Torrington, which have been added to Connoisseur stations in New Haven and Fairfield counties, WPLR, WYBC, the Fox and Star.
At WDRC, virtually within minutes, several on-air personalities, the general manager and program director became former employees. The station’s website and Facebook changed, a new logo was launched, and a station with a heritage as one of the nation’s best know music stations as rock-n-roll took root in the 1960’s adopted a tagline that read “Classic Hits of the ‘70’s, ‘80’s and More.” Veteran broadcasters Mike Stevens, ‘Rockin’ Ron Sedaille, Floyd Wright and Grahame Winters were all dropped by WDRC’s new owners this week, along with Vice President/General Manager Eric Fahnoe. 
The company’s largest cluster of stations is in the Northeast, predominantly in Connecticut, New York, New Jersey and Pennsylvania. But Connoisseur also owns stations in markets including Billings, MT, Rapid City, SD, Witchita, KS, Omaha, NE, and Bloomington, IL.
The station’s website now lists the quartet of Kim Zachary, Mike Lapitino, Allan Lamberti, and Rob Ray as on-air talent. Lapitino has been 99.1 WPLR’s afternoon air personality; Lamberti has handled the evening hours at th e New Haven-based station. Lamberti, who has also been on air at Connoisseur’s Fairfield County classic rock station, 95.9 FOX, was on the afternoon drive shift at WDRC-FM. Chaz & AJ, the veteran morning drive duo, are heard simultaneously on both the New Haven and Fairfield County stations.
CEO Jeffrey D. Warshaw founded Connoisseur Communications Partners, LP, in 1993. Through strategic purchases of multiple single radio stations in medium to small sized radio markets, the company grew to 39 stations (owned or operated) prior to this week’s final sale of the Connecticut stations. 
In May, the company also announced plans to purchase WALK-AM/FM on Long Island, where the company already owns four radio stations. Among them are some Classic Rock formatted stations, although a national study released this week suggests that what listens hear in such a format varies across the country.
A new study by the well-respected data-driven website FiveThirtyEight “found that classic rock is more than just music from a certain era, and that it changes depending on where you live. What plays in New York — a disproportionate amount of Billy Joel, for example — won’t necessarily fly in San Antonio, which prefers Mötley Crüe.” The website studied the airplay of classic rock stations in the nation’s top 30 markets for a week, and analyzed what was played.
“Classic rock is heavily influenced by region, and in ways that are unexpected. For example, Los Angeles is playing Pearl Jam, a band most popular in the 1990s, five times more frequently than the rest of the country. Boston is playing the ’70s-era Allman Brothers six times more frequently.” WDRC was not included in their review of classic rock stations in the nation’s top markets.
The website reported that “the trend steadily held” for songs “of the ’70s and through the mid-’80s,” with the 10-year period from 1973 to 1982 accounting for 57 percent of all song plays. When ‘60’s songs were played, they were predominantly from the Beatles, the study summary noted. “Classic rock peaked — by song plays — in 1973.” 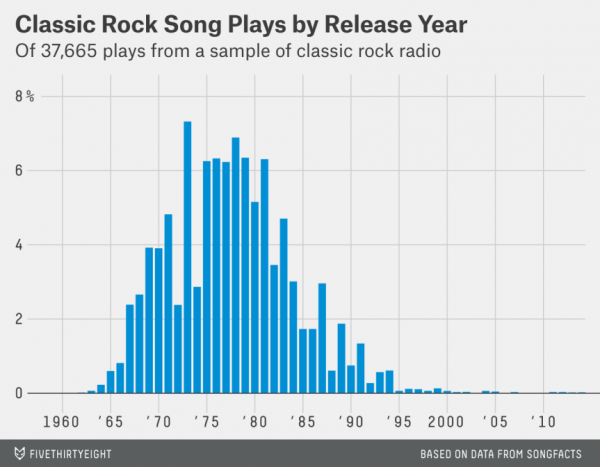
The analysis also found that “the top 25 most frequently played artists — the likes of Led Zeppelin, Van Halen and the Rolling Stones — together account for almost half of the spins on classic rock stations in the U.S. Another way of saying that is 5 percent of all the bands played on these stations made up nearly 50 percent of the song plays — which shows that there is at least a classic rock core.”
Staff changes are yet to be finalized, but at present Connoisseur ‘s General Manager for its stations in southern Connecticut, Kristin Okesson, will oversee the Hartford area stations. Okesson currently manages WPLR, WEZN, WFOX, and WYBC.
WDRC is considered the oldest radio station in Connecticut, begun in 1920 in New Haven by Franklin Doolittle Radio Corp., eventually relocating to Hartford (ultimately to 750 Main Street) and then to its current location at 869 Blue Hills Avenue in Bloomfield. WDRC-AM switched from a music to talk format decades ago, with WDRC-FM retaining the “Big D” style popularized in the ‘60’s and tweaked through the decades.


 thnic populations across the country are German (15.6% of the population), Irish (11%), Mexican (10%), English (8%), Italian (5%), Polish (3%) French (2%) Scottish (1% and Puerto Rican (1%).
 The numbers are increasing nationally as well as in Connecticut. In 2013, for the first time in a decade, the number of low-income children eating summer meals saw a substantial increase year-over-year, according to a
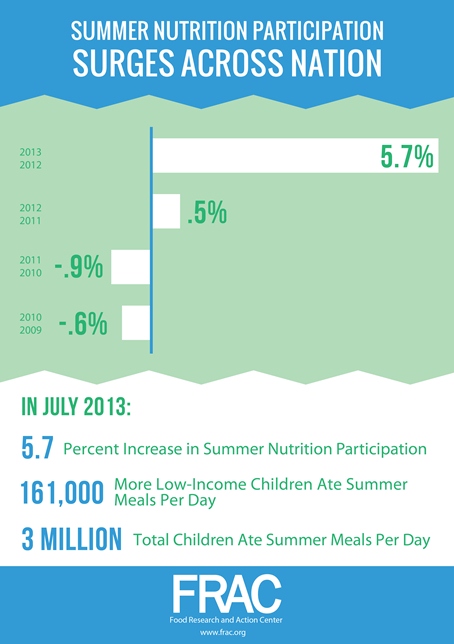
 The Summer Nutrition Programs, which include the Summer Food Service Program and the National School Lunch Program, are designed to fill the food gap for the thousands of low-income Connecticut children who rely on school breakfast and lunch during the school year. These programs provide free meals at participating summer sites at schools, parks, other public agencies, and nonprofits for children under 18.
 for over a third of Connecticut's public school students, only 7 percent of the state's teachers and 2 percent of the administrators in Connecticut's public schools are minorities."
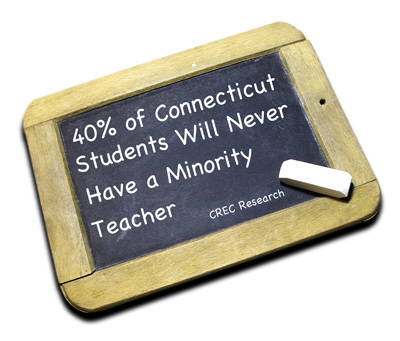
 2.
2.


 reas such as New York, Philadelphia, Chicago, Boston, Atlanta, and Washington.