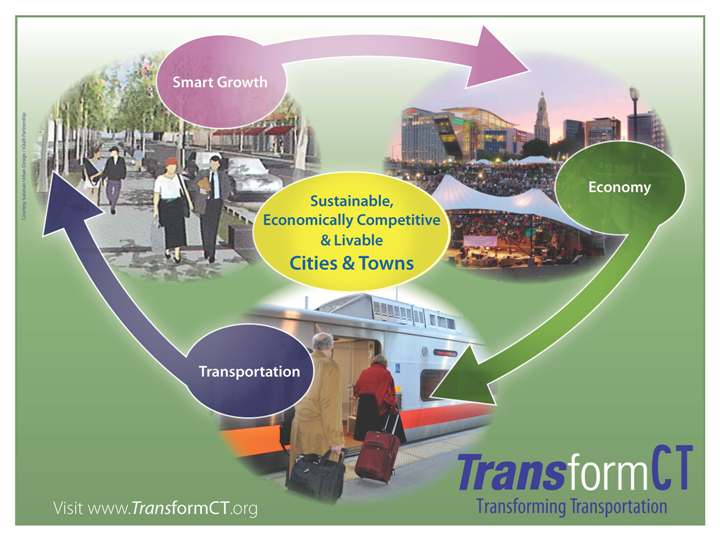
UConn researchers have collaborated to develop a new index that will measure the sustainability of complex urban transportation systems. The index will allow policymakers, scientists and the public to understand not just how congested cities’ transportation systems are, but the economic, social, and environmental impacts of the system as a whole.
A team of researchers in UConn’s departments of geography and civil and environmental engineering developed The Transportation Index for Sustainable Places, or TISP. The new approach is part of the July themed issue of the journal Research in Transportation Business & Management, edited by Carol Atkinson-Palombo, assistant professor of geography, Norman Garrick, associate professor of civil and environmental engineering, and Wesley Marshall, a former graduate student of Garrick’s who is now a faculty member at the University of Colorado, Denver. 
“Policy in developed countries and in the U.S. in particular has tended to focus on relieving congestion and has largely ignored social and environmental impacts associated with expanding freeways,” says Carol Atkinson-Palombo. “This index takes a more holistic approach, which gives a comprehensive sense of the effects of the system.”
The TISP takes into account environmental factors like land use efficiency, minimizing natural resource consumption, and reducing greenhouse gas emissions. Social factors are also measured, such as meeting access needs, incorporating public health and safety and maintaining a community in areas served by transportation. These factors combine with economic measures, such as affordability, self-sufficiency, and efficiency, to create a comprehensive metric, UConn Today reported.
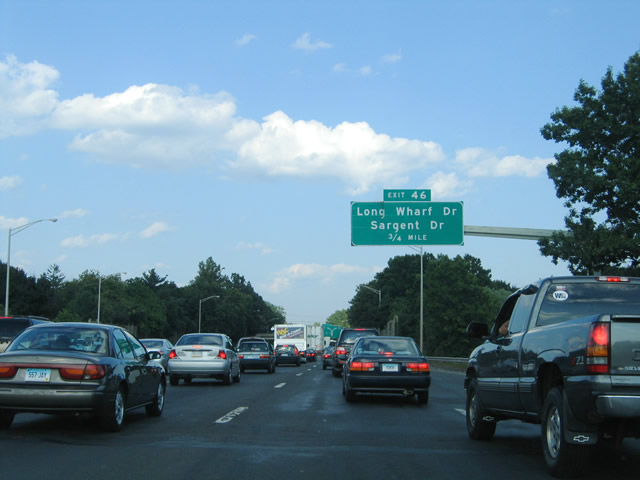
Garrick says that many people only think about transportation in terms of traffic. These so-called congestion indices, he says, are misleading because they are not necessarily about making the city better, but simply moving cars more efficiently.
“In many cities, only 40 percen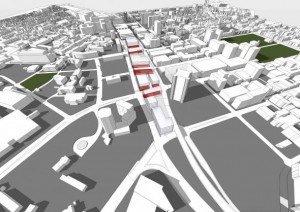 t of the people commuting are in cars,” he points out. “The majority of the people aren’t affected by the congestion index, yet this is the only measure of the impact of the transportation system that is ever discussed in the media.”
Mathematics of Cities
In another initiative aimed at taking a closer look at the function of cities, the view that cities are dissimilar and disordered systems has begun to change. Patterns have emerged within the supposed chaos, and researchers in economics, physics, complexity theory and statistical mechanics have concluded that cities, mathematically speaking, might actually be basically the same. Though strikingly different in culture and layout, cities like London and Beijing, for example, share many properties with regard to infrastructure, social interactions and productivity.
The new conclusions – decades in the making - are part of a growing field dedicated to the science of cities, Science News, the magazine of the Society for Science & The Public, reports in its most recent edition. Roughly 75 percent of people in the developed world now live in urban environments. While much of the research is in its early days, eventually it may serve as a powerful, widely used tool for urban planners and policymakers, the publication reports.
Physicist and complex systems scientist Luís Bettencourt of the Santa Fe Institute in New Mexico has developed a theory which captures the interplay between a city’s population, its area, the properties of its infrastructure and its social connectivity. His theory suggests that city planning should not involve grand, top-down projects, but perhaps well-considered smaller ones.
The mathematical work is rooted in and reinforces the view “that cities grow from the bottom up,” says Michael Batty, who trained as an architect, planner and geographer and went on to found the Centre for Advanced Spatial Analysis at University College London. “The diversity of life [in cities] offers greater opportunities for mixing ideas.”
The emerging mathematical theory of cities stands on four basic assumptions:
- Cities mix varied people together, allowing them to reach each other.
- Cities are networks that grow gradually and incrementally, connecting people.
- Human effort isn’t limitless and stays the same regardless of urban size.
- Measures of the socioeconomic output of a city — things like the number of patents awarded or crime rate — are proportional to the number of social interactions.
“In a nutshell, the city is the best way of creating a vast, open-ended social network that minimizes the cost of moving things in and around an environment,” Bettencourt says. “When people brush up against each other, that’s when the magic of the city happens — the social reactor begins to work.”
Cities Reshape Transportation Mix
At UConn, when the research team used the TISP index to look at transportation in the U.S., they found some not-so-surprising results: areas with higher rates of driving rather than public transportation have greater carbon emissions, and having more cars and highways increases traffic fatality risk. But despite the prevailing perception, says Garceau, the researchers found that de veloping varied transportation systems that include a combination of roads and public transportation are more cost-effective than simply building highways.
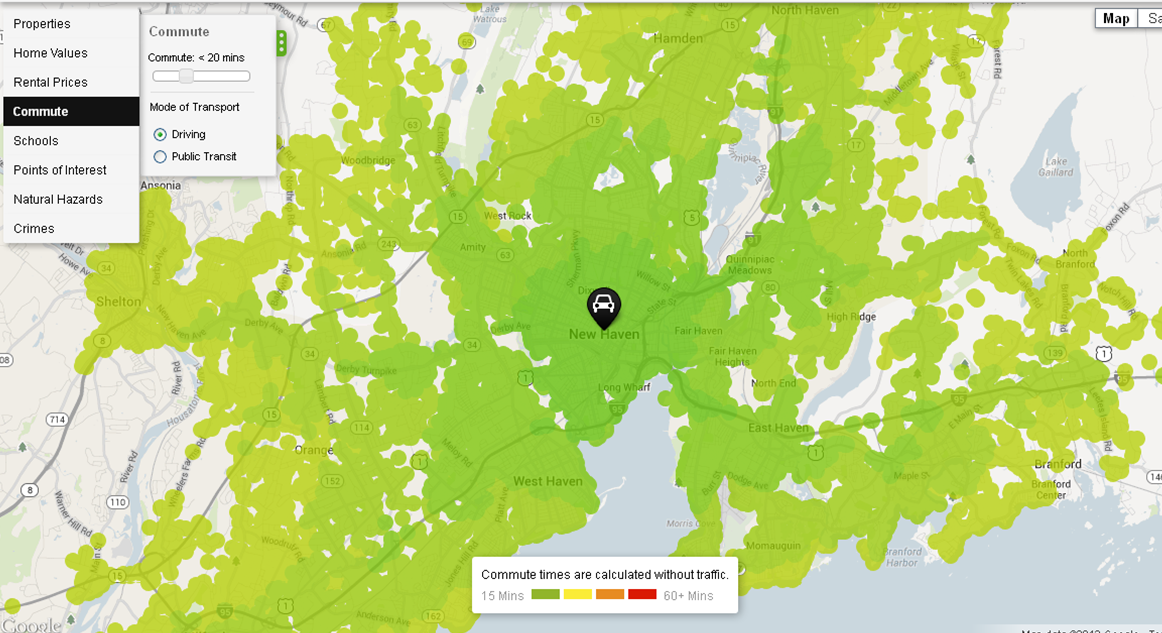
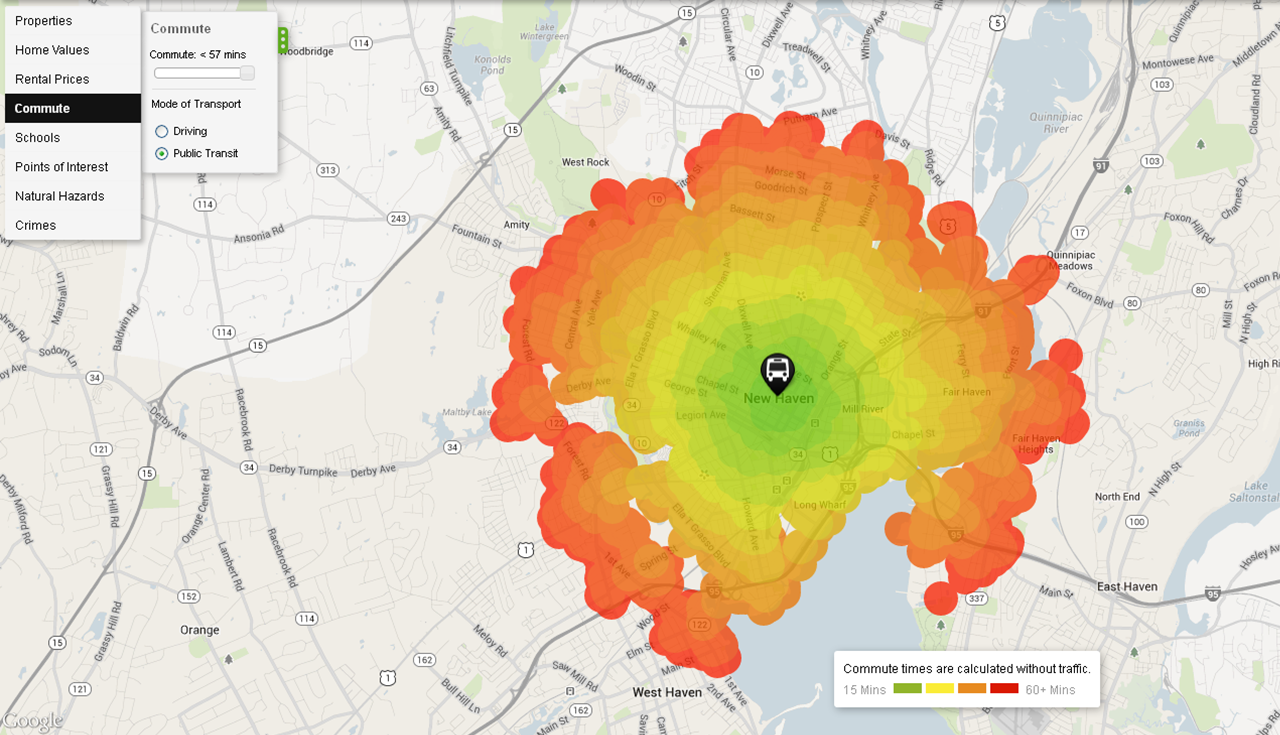
Many cities have already begun to adjust their transportation planning. Some have begun dismantling freeways that run through their downtowns to reconstruct a truly urban atmosphere. New Haven is in the midst of doing precisely that in Connecticut, eliminating the Route 34 connector and replacing it with an urban boulevard that will reconnect city neighborhoods cut off for decades.
Others cities are moving forward with light rail and bus rapid transit systems (such as CTfastrak between Hartford and New Britain, now under construction) and encouraging walking and bicycle use by building compact, mixed-use communities that focus on pedestrians rather than cars. Garrick points to Cambridge, Mass., Portland, Ore., and New York City as U.S. cities that have taken strides toward sustainable transportation. On a smaller scale, he cites Storrs, the home of UConn’s main campus, for developing a walkable town center from scratch, and planning for greater bus access as the newly-minted downtown area unfolds.


 e for Highway Safety reports that 29 states and the District of Columbia have additional license renewal procedures for older drivers, often age 65 or 70 and older. In Connecticut, people 65 and older may choose a 2-year or 6-year renewal cycle. A personal appearance at renewal generally is required. Upon a showing of hardship, people 65 and older may renew by mail. There are no additional requirements for older drivers, according to the Insurance Institute.
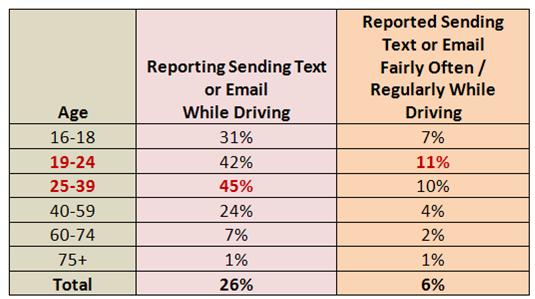
 ation for Traffic Safety indicates that high school-aged teens report using their phones or texting while driving substantially less often than adults do. The AAA survey found that adult drivers ages 25-39 were the most likely to admit engaging in these risky behaviors behind the wheel.
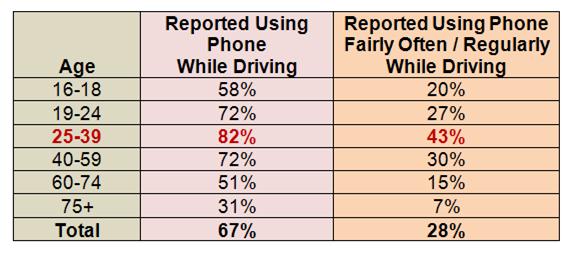
 of electronic devices in vehicles.
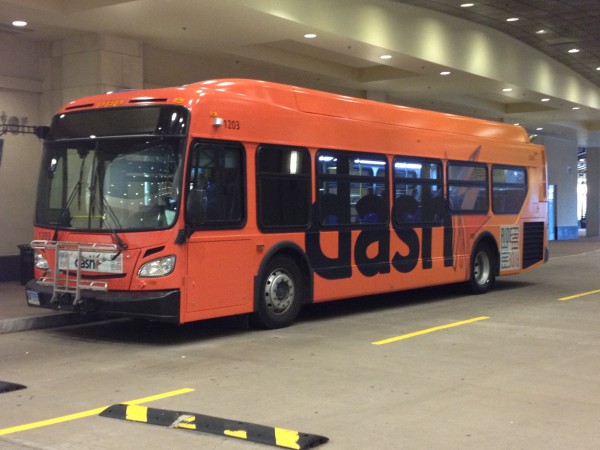 n among CT TRANSIT, CT DOT, the City of Hartford, the Capitol Region Development Authority, the Hartford Business Improvement District, the Hartford Metro Alliance, and the Connecticut Convention & Sports Bureau.
 ted the time has come to showcase the rebranding and new shuttle name! I chose "dash" not only because of the acronym (Downtown Area SHuttle) but also because it's an action word --"dash," to me, is exciting, inviting, and invokes you to hop on and discover Downtown."
 nd the vehicles alternate in providing the service. The DASH shuttle is a service of the CT Department of Transportation and operated by CT TRANSIT. Information on the route and extended service hours can be found at
  percent.)