Time Short to Nominate State’s Top Librarians; CT Seeks Another Stand-out Year

Nominations for the 2013 Carnegie Corporation of New York/New York Times I Love My Librarian Awards are open through September 6.  For Connecticut librarians, last year’s success will be tough to top.

The I Love My Librarian Award encourages library users to recognize the accomplishments of exceptional public, school, college, community college, or university liblove my librarianrarians. It is a collaborative program of Carnegie Corporation of New York, The New York Times and the American Library Association.

Ten librarians in 2012 – including two from Connecticut - received a $5,000 cash award, a plaque and $500 travel stipend to attend an awards reception hosted by The New York Times. A plaque was also given to each award winner’s library.

Rachel Hyland, a reference and collection development librarian at Tunxis Community College in Farmington, and Rae Anne Locke, library/media specialist at the Saugatuck Elementary “Secret Garden” Library in Westport, were two of the 10 recipients a year ago.  The others worked at libraries in New Mexico, California, North Carolina, New York and Florida.

In order to be eligible, each nominee must be a librarian with a master’s degree from a program accredited by the ALA in library and information studies or a master’s degree with a specialty in school library media from an educational unit accredited by the National Council for the Accreditation of Teacher Education.

rachel-hyland135rae-anne-locke135Nominees must be currently working in the United States in a public library, a library at an accredited two- or four-year college or university or at an accredited K-12 school.

Hyland (left), nominated by Sally Terrell, is described as “a rock-star librarian.  The intelligence, wit, energy she brings to her work has changed the way all of us – from students to faculty to administrators – think about information literacy.”  Locke (right) , nominated by Melissa Augari, has “poured her heart and soul into planning, creating and growing the SES Secret Garden Library, a vibrant, warm and inviting place that is much more than a school library. It is truly the learning hub for our entire school community.” Her collaborative projects “often reach out beyond the school community” and one student said simply, “it’s magical.”

In order to nominate a librarian, five questions must be answered on the contest’s website:

  • What sets him/her apart?
  • Please list a few ways in which the nominee has helped you and made your experience of the library a positive one. For instance, did the nominee inspire in you a love for literature; assist you in a project or finding other information?
  • How has the librarian made a difference in the community?
  • How has the library, and the nominee, improved the quality of your life?
  • How does the nominee make the library a better place?

More information is available at www.ilovelibraries.org. Nominations must be submitted using the online form, and submitted in their entirety.


love librarians

Cost of Raising A Child Is Highest in Northeast U.S., Including CT

The cost of raising a child:  priceless.  Well, no, there is a price-tag.  The U.S. Department of Agriculture (USDA) released its annual report, Expenditures on Children by Families, which shows that a middle-income family with a child born in 2012 can expect to spend about $241,080 ($301,970 adjusted for projected inflation*) for food, shelter, and other necessities associated with child-rearing expenses over the next 17 years.

There was an overall 2.6 percent increase from 2011.  Expenses for child care, education, health care, and clothing saw the largest percentage increases related to child rearing from 2011. However, there were smaller increases in housing, food, transportation, and miscellaneous expenses during the same period. The 2.6 percent increase from 2011 to 2012 is also lower than the average annual increase of 4.4 percent since 1960.

The report notes geographic variations in the cost of raising a child, with expenses the highest for families living in the urban Northeast  - the 9-state northeast region, which includes Connecticut, Maine, Massachusetts, New Hampshire, New Jersey, New York, Pennsylvania, Rhode Island, and Vermont -followed by the urban West and urban Midwest. Families living in the urban South and rural areas have the lowest child-rearing expenses.report child expense

The report, issued annually, is based on data from the Federal government's Consumer Expenditure Survey, the most comprehensive source of information available on household expenditures. There is also  an interactive web version of the report where individuals can easily enter the number and ages of their children to obtain an estimate of costs through age 17.

Housing accounted for the largest share of total child-rearing expenses. For the middle and highest income groups (for households with the expense), child care and education was the second largest expenditure on a child, accounting for 18 and 23 percent of child-rearing expenses, respectively. For the lowest income group, child care and education accounted for 14 percent of total child-rearing expenses (again, for households with the expense). For lower income families, child care may be provided by relatives or friends at no cost due to affordability issues, the report pointed out.

Expenses per child decrease as a family has more children. Families with three or more children spend 22 percent less per child than families with two chchild expensesildren. As families have more children, the children can share bedrooms, clothing and toys can be handed down to younger children, food can be purchased in larger and more economical quantities, and private schools or child care centers may offer sibling discounts.

Among the largest potential costs in child-rearing is the cost of a college education, which was not included in this study, which only included direct parent expenses through age 17. The College Board estimated that in 2012-2013, annual average (enrollment-weighted) tuition and fees were $8,655 at 4-year public colleges (in-State tuition) and $29,056 at 4-year private (non-profit) colleges; annual room and board was $9,205 at 4-year public colleges and $10,462 at 4-year private colleges. For 2-year colleges in 2012-2013, annual average tuition and fees were $3,131 at public colleges. These college costs may be offset by financial aid.

The report concluded, as only a government report could, by stating: “The direct and indirect costs of raising children are considerable, absorbing a major share of the household budget. On the other hand, these costs may be outweighed by the benefits of children.”

The full report is available on the web at www.cnpp.usda.gov. A video highlighting the report is at http://www.youtube.com/watch?v=Di14Y3kTbHE

Mathematics and Transportation of Cities Draws New Research Analysis

UConn researchers have collaborated to develop a new index that will measure the sustainability of complex urban transportation systems.  The index will allow policymakers, scientists and the public to understand not just how congested cities’ transportation systems are, but the economic, social, and environmental impacts of the system as a whole.

A team of researchers in UConn’s departments of geography and civil and environmental engineering developed The Transportation Index for Sustainable Places, or TISP.  The new approach is part of the July themed issue of the journal Research in Transportation Business & Management, edited by  Carol Atkinson-Palombo, assistant professor of geography, Norman Garrick, associate professor of civil and environmental engineering, and Wesley Marshall, a former graduate student of Garrick’s who is now a faculty member at the University of Colorado, Denver. TISP

“Policy in developed countries and in the U.S. in particular has tended to focus on relieving congestion and has largely ignored social and environmental impacts associated with expanding freeways,” says Carol Atkinson-Palombo. “This index takes a more holistic approach, which gives a comprehensive sense of the effects of the system.”

The TISP takes into account environmental factors like land use efficiency, minimizing natural resource consumption, and reducing greenhouse gas emissions. Social factors are also measured, such as meeting access needs, incorporating public health and safety and maintaining a community in areas served by transportation. These factors combine with economic measures, such as affordability, self-sufficiency, and efficiency, to create a comprehensive metric, UConn Today reported.

Garrick says that many people only think about transportation in terms of traffic. These so-called congestion indices, he says, are misleading because they are not necessarily about making the city better, but simply moving cars more efficiently.

“In many cities, only 40 percenNewHavenRoute34aftert of the people commuting are in cars,” he points out. “The majority of the people aren’t affected by the congestion index, yet this is the only measure of the impact of the transportation system that is ever discussed in the media.”

Mathematics of Cities

In another initiative aimed at taking a closer look at the function of cities, the view that cities are dissimilar and disordered systems has begun to change.  Patterns have emerged within the supposed chaos, and researchers in economics, physics, complexity theory and statistical mechanics have concluded that cities, mathematically speaking, might actually be basically the same. Though strikingly different in culture and layout, cities like London and Beijing, for example, share many properties with regard to infrastructure, social interactions and productivity.

The new conclusions – decades in the making - are part of a growing field dedicated to the science of cities, Science News, the magazine of the Society for Science & The Public, reports in its most recent edition.   Roughly 75 percent of people in the developed world now live in urban environments. While much of the research is in its early days, eventually it may serve as a powerful, widely used tool for urban planners and policymakers, the publication reports.

Physicist and complex systems scientist Luís Bettencourt of the Santa Fe Institute in New Mexico has developed a theory which captures the interplay between a city’s population, its area, the properties of its infrastructure and its social connectivity. His theory suggests that city planning should not involve grand, top-down projects, but perhaps well-considered smaller ones.

The mathematical work is rooted in and reinforces the view “that cities grow from the bottom up,” says Michael Batty, who trained as an architect, planner and geographer and went on to found the Centre for Advanced Spatial Analysis at University College London. “The diversity of life [in cities] offers greater opportunities for mixing ideas.”

The emerging mathematical theory of cities stands on four basic assumptions:

  1. Cities mix varied people together, allowing them to reach each other.
  2. Cities are networks that grow gradually and incrementally, connecting people.
  3. Human effort isn’t limitless and stays the same regardless of urban size.
  4.   Measures of the socioeconomic output of a city — things like the number of patents awarded or crime rate — are proportional to the number of social interactions.

 “In a nutshell, the city is the best way of creating a vast, open-ended social network that minimizes the cost of moving things in and around an environment,” Bettencourt says. “When people brush up against each other, that’s when the magic of the city happens — the social reactor begins to work.”

Cities Reshape Transportation Mix

At UConn, when the research team used the TISP index to look at transportation in the U.S., they found some not-so-surprising results: areas with higher rates of driving rather than public transportation have greater carbon emissions, and having more cars and highways increases traffic fatality risk.  But despite the prevailing perception, says Garceau, the researchers found that decityveloping varied transportation systems that include a combination of roads and public transportation are more cost-effective than simply building highways.
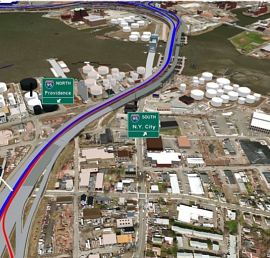
Many cities have already begun to adjust their transportation planning. Some have begun dismantling freeways that run through their downtowns to reconstruct a truly urban atmosphere. New Haven is in the midst of doing precisely that in Connecticut, eliminating the Route 34 connector and replacing it with an urban boulevard that will reconnect city neighborhoods cut off for decades.

Others cities are moving forward with light rail and bus rapid transit systems (such as CTfastrak between Hartford and New Britain, now under construction) and encouraging walking and bicycle use by building compact, mixed-use communities that focus on pedestrians rather than cars.  Garrick points to Cambridge, Mass., Portland, Ore., and New York City as U.S. cities that have taken strides toward sustainable transportation. On a smaller scale, he cites Storrs, the home of UConn’s main campus, for developing a walkable town center from scratch, and planning for greater bus access as the newly-minted downtown area unfolds.
Need a Job? Study Says Volunteering First Can Help

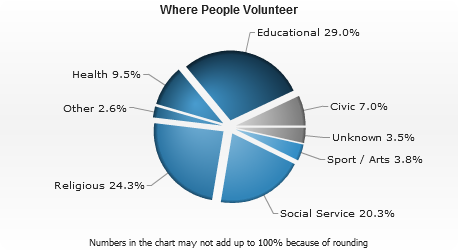
If you are unemployed, it pays to volunteer.  That is the finding of a new analysis by the Center for Economic and Policy Research, tracking individuals out of work who chose to volunteer, and the impact it had on their search for employment.

The report, “Does It Pay to Volunteer: The Relationship Between Volunteer Work and Paid Work,”  estimates non-working individuals’ probability of being employed a year later if they volunteered during the 12-month period. Pooling three years of data from the Current Population Survey (CPS) Volunteer Supplement covering the period ending in September of 2011, the analysis found a positive volunteer effect on the probability of employment for persons who were not employed and volunteered for more than 20 hours per year.

For example, the employment rate for non-working persons who volunteered between 20 and 49 hours per year was 57 percent higher than the rate of non-voluntewhere people volunteerers. And controlling for personal characteristics such as age, gender and ethnicity, there was a substantial increase (6.8 percentage points) in the probability of employment for persons who volunteered between 20 and 99 hours per year.

In Connecticut, among the many ways to volunteer - most with local community-based organizations - the United Way has developed a web site, www.volunteerConnecticut.org , to match interested individuals with volunteer opportunities.  The Connecticut Association of Nonprofits, at www.ctnonprofits.org, also has a website devoted to volunteering.

The latest statewide data for Connecticut, complied by the Corporation for National & Community Service using 2011 data, indicates that volunteerism is considerable across the state:

  • 28.5% of residents volunteer, ranking them 22nd among the 50 states & Washington, DC.
  • 29.3 volunteer hours per resident.
  • 72.8% do favors for their neighbors.
  • 793,710 volunteers.
  • 81.7 million hours of service.
  • $1.8 billion of service contributed.

In the survey, many volunteers did not volunteer in the professional field in which they were seeking employment. This suggests that even without accumulating the relevant human capital for the fields in which they were seeking employment, volunteering may have signaled to prospective employers that the applicant possessed desirable qualities such as motivation, creativity and reliability.

Thus, volunteering could be particularly useful for job applicants with little prior experience such as recent college graduates or persons attempting to re-enter the labor market after a period of joblessness. The data did not indicate that volunteering has a significant impact on wage growth of the typicheaderal person.

For purposes of the survey, a volunteer was defined as person who performed unpaid volunteer activities over the previous 12 months through or for an association, society or group of people who share a common interest.  Volunteering in an informal manner, such as helping an elderly neighbor is not included in the survey. Unpaid work, including internships for for-profit employers, is also not considered volunteer work, while some other types of unpaid internships may be included, if the person considered it volunteering rather than work.

Half of Eligible Teenagers Delay Drivers License, Study Finds

In an unexpected sign of the times, about half of the teenagers in the U.S. who are old enough to obtain a drivers license are waiting to do so, according to a new survey.  The most common reasons cited for delayed licensure were not having a car, being able to get around without driving, and costs associated with driving.

The study, by the AAA Foundation for Traffic Safety, found that less than half (44 percent) of teens obtain a driver’s license within 12 months of the minimum age for licensing and just over half (54 percent) are licensed before their 18th birthday. These findings mark a significant drop from two decades ago when data showed more than two-thirds of teens were licensed by the time they turned 18, accordidelayed licenseng to AAA.

The report found “Large social and economic disparities in licensing rates and in the timing of licensure.” Low-income, African-American and Hispanic teens are the least likely to obtain a driver’s license before age 18.

Only 25 percent of teens living in households with incomes less than $20,000 obtained their license before they turned 18, while 79 percent of teens were licensed by their 18th birthday in households with incomes of $100,000 or more.

 The findings for licensure by age 18 also differed significantly by race and ethnicity, with 67 percent for non-Hispanic white teens, 37 percent for non-Hispanic black teens, and 29 percent for Hispanic teens.

Some had suggested that teens were waiting simply to avoid graduated driver’s licensing (GDL), missing both the limitations and benefits of the laws, which vary across states, aimed at improving new driver training and safety, and causing some concern.  The survey, however, did not find this to be a prominent reason in delayed licensing.  A number of other reasons for delaying licensure were cited, including:

  • 44 %– Did not have a car
  • 39 % – Could get around without driving
  • 36 %– Gas was too expensive
  • 36 % – Driving was too expensive
  • 35 % – Just didn’t get around to it

Many states impose the GDL restrictions only for new drivers younger than 18.  The AAA report indicated that “Given the  large proportion of new drivers who are 18 years old or older, further research is needed to investigate their levels of safety or risk, to evaluate the potential impacts of extending GDL systems to new drivers aged 18 and older, and to explore other ways to address the needs of older novice drivers.”

In Connecticut, anyone 18 years of age or older must hold an adult learner’s permit for 3 months before obtaining a driver's license.  The state Department of Motor Vehicles website outlines the procedures in Connecticut, which have been revised as recently as January 2013 based on new laws approved by the state legislature.

The proportion of teens who were licensed varied strongly by geographic region, the AAA study found: licensing rates were much higher in the Midwest (82%) than in the Northeast (64%), South (68%), or West (71%).

The study did not discern major variations by gender among teens.  Although males were slightly more likely than females to obtain a license within six months of their state’s minimum age (33% vs. 28%), females were actually slightly more likely than males to obtain a license within 1-2 months of their state’s minimum age.

The researchers surveyed a nationally-representative sample of 1,039 respondents ages 18-20. The full research report and results are available on the AAA Foundation for Traffic Safety website.

Free Summer Meals Program for Children Aims to Provide Nutrition, Sustain Academic Progress

Turns out, there is a free lunch.  In fact, Connecticut’s summer meal program for children 18 and under is providing hundreds of lunches – and breakfasts.  As Governor Malloy points out in a radio commercial now being broadcast around the state, 3 in 4 Connecticut children who could receive free meals aren’t doing so.

Officials say that the absence of good nutrition over the summer – when children are out of school and school lunch programs are unavailable - may contribute to children slipping somewhat in their educational progress.  “Summer learning loss,” they say, may be caused in part by “summer nutrition loss.”  The free Summer Meals program aims to turn that around.

The statistics are startling.  There are 100,000 children in Connecticut who don’t know where their next meal is coming from, according to Lieut. Gov. Nancy Wyman, who helped to kickoff the statewide initiative, and joins the Governor in the radio announcement.   That is why more than 400 locations around the state,  including churches, parks, schools and even some pools, are serving free meals to children throughout the summer afree lunchs part of the summer meals program and the state’s ongoing End Hunger Connecticut initiative.

A new interactive website, www.ctsummerfoods.org, was launched at the beginning of the summer that lists all the locations serving the meals.  The site allows people to simply type in a town or zip code to see a list of locations in that area that offer the meals.

Children and teens, under 18, do not have to be receiving free or reduced price school meals during the school year to eat a free, nutritious, summer meal and/or snack at participating locations.  Connecticut ranks 5th in country, as of 2012, for such programs, with  about 25% of children who are eligible are receiving the breakfasts.  “We need to do better,” said Stefan Pryor, Commissioner of the State Department of Education, when the program began just after the school year ended.

The program website notes that “Only 25.8 of every 100 low-income students that participate in school lunch also participate in summer nutrition. If participation reached 40 percent, an additional 19,558 students would be reached and that would bring an additional $1.35 million federal dollars into the state.”

By heightening visibility of this program, the Connecticut No Kid Hungry campaign and its partners aim to increase participation in the state’s 2013 summer meals program by 9 percent. Flyers and other program material is available on-line to help local organizers get the word out in their communities.

In launching the program, “Blitz Days” were held in Hartford, Groton, Naugatuck, Norwalk and Waterbury to bring attention to the initiative, which is mostly funded by the federal government.  CT News Junkie has reported that program organizers don’t ask too many questions of those coming to receive meals. Income guidelines are not required because the idea is not to discourage anyone from receiving a meal, state officials said.

Last year the state of Connecticut received 20120717-ShareOurStrength_CT-0062-slider$1.55 million to administer the program. The bulk of that or $1.3 million was used to purchase food. Summer meals are paid for by the United States Department of Agriculture (USDA). The Connecticut State Department of Education works with the USDA to reimburse sponsors for the summer meals they provide to children and teens, under 18, at participating summer meals locations.

For details on dates and times that meals and/or snacks are being served at particular locations, individuals can use the Location Finder, text “CTmeals” to 877877, or call, toll-free, 2-1-1.  It is anticipated that the program will continue until the start of the school year in late August.

Patients Rate Hospitals in CT: Middlesex, Danbury, St. Vincent's Top Lists

When asked how they rated their hospital stay, about two-thirds of patients in Connecticut hospitals offer the highest, or very high, ratings.  And when asked if they would recommend the hospital to friends and family, a greater number, 72 percent on average, say they “definitely” would.  A closer look at the number  included in the U.S. News report on best hospitals, shows distinctions among Connecticut’s medical institutions – according to their patients.

Those receiving the largest percentage of very high overall ratings from patients are Middlesex Hospital (76%), St. Vincent’s Medical Center (73%), Danbury Hospital (72%) and Yale-New Haven Hospital (68%) – the only facilities to exceed the statewide average of 66 percent.

Topping the liPatient-Survey-st of those that would definitely be recommended to family and friends by patients were Middlesex Hospital and Danbury Hospital, both with 79%, and St. Vincent’s Medical Center and Yale-New Haven Hospital, each with 77%.  Others exceeding the statewide average of 72 percent were St. Francis Hospital and Medical Center, Hartford Hospital, and Stamford Hospital, all with 73 percent.

The hospitals with the lowest percentage of patients offering the highest overall rating were Waterbury Hospital and Bristol Hospital.  The lowest percentage who would recommend the hospital at which they were patients to their friends and family were Charlotte Hungerford Hospital in Torrington, Bristol Hospital, and Waterbury Hospital.


In addition to those responses, data is developed based on patient responses to questions related to pain control, staff courtesy, cleanliness of facilities, staff responsiveness to patient needs, and information provided related to discharge and recovery.

The data was compiled in August 2012 and release this month.

patients say

Veterans Education and Career Training Gains New Focus in Connecticut

With veterans returning from active duty in increasing numbers and seeking to pursue higher education or achieve a place in the workforce, efforts are underway in Connecticut to respond.

The Veterans Vocational Training Program (VVTP), is a new initiative of Hartford-based Connecticut Public Broadcasting Network (CPBN).  The program offers veterans,free of charge, two different programs of study.  Media Arts, which focuses on the Adobe programs Photoshop, Illustrator, and In-Design, is offered during the Fall 2013 semester, which begins on August 26.   The other program seeks to develop the talents of budding video producers and editors.

Both programs incluveteransde 90 hours of classroom instruction, professional portfolio development, and an additional 60 hours of hands-on learning. In addition, the VVTP helps potential employers connect with veterans seeking specific employment opportunities.

There will be an Open House for veterans to learn more about the program on July 18 at5:30 PM at CPBN, located at 1049 Asylum Avenue in Hartford.  Inquiries about the program can be directed to Major (ret) Tim Krusko, Program Manager, at 860-275-7337 or email veterans@cpbn.org.  Questions can also be directed to CPBN’s Director of Education Services, Donna Sodipo at dsodipo@cpbn.org or 860.275.7337.  Individual tours of the facilities are also available.

The initiative has quickly developed a wide range of partners that will help CPBN provide veterans with a real-world education while increasing their employment opportunities. CPBN is also reaching out to colleges and universities for referrals of veterans who might benefit from the VVTP as a no-cost way to supplement or enhance their current media education experience through hands-on learning. The VTTP is not restricted to Connecticut residents.

The Fall 2013 semester starts August 26, 2013 and ends December 19, 2013.  The Spring semester will run January 13 through May 12, 2014.  The goal is to have 85 percent of program participants successfully employed after completing the program.

In a separate effort, the Connecticut Conference of Independent Colleges, which includes 16 higher education institutions in the state, recently held a one day, state-of-the-art training for over 100 campus participants from throughout Connecticut that focused on military culture and serving student veterans.

Offered by the Center for Deployment Psychology, the training was designed to increase competency in the concerns, challenges, culture and experience of service members and veterans attending college. Mental health professionals as well as non-clinical university staff specializing in student affairs, financial aid, disability services, housing, campus security and oveterans learning labthers attended.

The training covered:

·  Culture and Experience of Service Members & Veterans on Campus

·  The Deployment Cycle and its Impact on Students

·  Reintegration on Campus

·  Outreach Strategies and Group Exercise

·  Overview of Treatments for PTSD on Campus

The training was offered free of charge to every non-profit public and private college in Connecticut.  It funded by a grant from the Bob Woodruff Foundation and was offered through a collaboration of the American Council on Education and the Center for Deployment Psychology at the Uniformed Services University of the Health Sciences.  The event was part of an ongoing effort coordinated by CCIC “to help campus representatives learn best practices and gain an understanding of resources available to make the campus experience successful for those who made the commitment to protect and serve our country.”

The VTTP is made possible through the generous corporate sponsorship of organizations and businesses including the Wounded Warrior Project, Newman’s Own Foundation, Walmart Foundation, the SBM Charitable Foundation, Farmington Bank Community Foundation and the Corporation for Public Broadcasting.  Wounded Warrior Project awarded CPBN with a $250,000 grant for the economic empowerment of wounded warriors and their family members. CPBN is currently seeking additional grant programs to help grow the program beyond the first year and replicate it in other parts of the country.

The VVTP program is a component of CPBN’s soon-to-be-completed $3.5 million Learning Lab, which will also offer education programming aimed at Hartford public school students. CPBN will dedicate a state-of-the-art learning space to these initiatives, to include studios, sound rooms, classrooms, offices, and video production and media arts facilities.

veteranprogramenrollmentFY11

Teacher Training in STEM Fields to Expand in CT

Connecticut’s drive to improve both teacher training and the caliber of Science, Technology, Engineering and Math (STEM) education being provided to students across the state received a boost with the announcement that the Connecticut Science Center would be tripling the capacity of its teacher professional development program, the result of a grant from Joyce D. and Andrew J. Mandell.

The number of teachers participating in the program will increase from 500 to 1,500 annually over the next few years, officials said, with the goal of giving educators the tools they need to meet rigorous new state and national standards for STEM education and core curricula.

Governor Dannel Malloy, State Education Commissioner Stephan Pryor, Hartford Mayor Pedro Segarra and Hartford’s 2012 Teacher of the Year Keith Sevigny, photoa past participant in the professional development program, were among those joining Connecticut Science Center President and CEO Matt Fleury in making the announcement.

In addition to expanding its capacity to serve more teachers, the newly named Joyce D. and Andrew J. Mandell Academy for Teachers at the Connecticut Science Center will also award graduate-level college credit through Charter Oak State College for certain programs.  Academy offerings include Student Engagement Strategies, Inquiry Teaching and Learning, STEM Education Units, Science Content Workshops, Engineering Practices, and Science Coaching. Teachers completing the covered courses can earn a total of nine credits toward their Master’s degrees over a three-year period.

Governor Malloy said the announcement made it a day of “celebration,” emphasizing that the impact “will be played out in the years to come.”  Reiterating his commitment to education and economic development, the Governor said this effort is another example of initiatives designed to “allow our state to compete.”  He  noted the BioScience Connecticut initiative and recently approved growth plans for the University of Connecticut as further indications of the state’s commitment.

Described as a “high-impact professional development program for educators,”  the Academy is “committed to supplying educators with professional development experiences that support rigorous science and curriculum standards.”   Commissioner Pryor, underscoring the challenges in education, pointed out that “15 countries do better than the U.S. in science and 24 do better in math.”  Pryor added that “we can prepare students for jobs of the future, but not if we are slipping in math and science.”

Officials pointed out that new nationally mandated benchmarks such as the Next Generation Science Standards and Common Core Education Standards will require teachers to seek training to improve the way they teach science and integrate it with the rest o f their curriculum.

“We want every child in the state to be able to compete,” said Joyce Mandell. “Teaching teachers how to connect with their students is one of the most important things we’ve ever done.  We’re very proud of our association with the Connecticut Science Center.”

Citing a story published in U.S. News, the website CT Stem Jobs, reported last month that about 20 percent of all American jobs are now in the science, technology, engineering and mathematics fields, with half of those open to workers who don't have a four-year college degree, according to a new report by the Brookings Institution called "The Hidden STEM Economy."

Those jobs constitute a "hidden STEM economy," the Washington, D.C.-based think tank says, because they are "prevalent in every large metropolitan area," but many people believe at least a bachelor's degree is necessary to work in careers that require STEM skills. Many of these so-called "blue-collar" stem jobs are in construction, installation, manufacturing and health care. They include registered nurses, mechanics, carpenters and electricians.

"Of the $4.3 billion spent annually by the federal government on STEM education and training, only one-fifth goes towards supporting sub-bachelor's level training, while twice as much supports bachelor's or higher level-STEM careers," the report says. "The vast majority of National Science Foundation spending ignores community colleges. In fact, STEM knowledge offers attractive wage and job opportunities to many workers with a post-secondary certificate or associate's degree."

Connecticut Ranks 17th in Beach Closings/Advisories in 2012

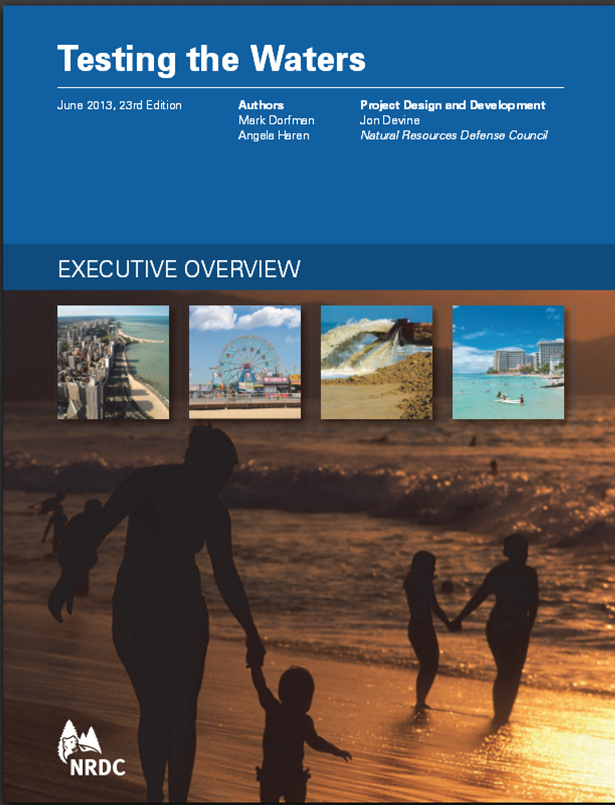
As the summer beach season moves into full swing, Save the Sound, a program of Connecticut Fund for the Environment, is calling attention to the number of days that Connecticut beaches had to be closed, or were under public advisories during 2012 due to environmental or related factors. The Natural Resources Defense Council’s (NRDC) annual “Testing the Waters” report, issued last week, found that Connecticut beaches were closed or under advisories for 198 days in 2012. That is down from 538 in 2011 but still more than twice the number of closings/advisories in 2010, 2009, or 2008.

The report analyzes beach closure and advisory statistics from beaches around the U.S.; Connecticut ranked 17th out of the 30 states listed.testing the waters

According to the NRDC report, 22 percent of Connecticut’s closing/advisory days last year were due to monitoring that revealed elevated bacteria levels and 29 percent were preemptive due to heavy rainfall, which can overwhelm outdated stormwater systems and wash untreated sewage into rivers and the Sound. The remaining days were preemptive due to wildlife.

The beaches with the worst records for exceeding the state's daily maximum bacterial standard were Pear Tree Point Beach in Fairfield County and Seabluff Beach in New Haven County, which tested above the maximum 28 percent of the time; Oak Street B Beach in New Haven County at 20 percent; and Fairfield County’s Calf Pasture Beach, Weed Beach, and Rowayton Beach, all at 19 percent.

“When it comes to clean water, being ‘middle-of-the-pack’ is not good enough,” said Leah Schmalz, director of legislative and legal affairs for Save the Sound. “One out of every ten American citizens lives within an hour’s drive of Long Island Sound, and they deserve clean, safe beaches—even one closing because of bacteria and pollution is too many.”

“Just an inch of rain in 24 hours causes many local health departments around the Sound to shut down beaches. Drought conditions may provide the perfect beach weather—no rain means no contamination from stormwater runoff—but we can’t rely on Mother Nature to do our pollution control for us. If we want to enjoy our coastline, eat local seafood, and promote tourism along the shore, rain or shine, we have to be proactive. That means stopping pollution at the source by upgrading our sewage treatment plants, separating the combined sewer overflows that dump almost two billion gallons of untreated sewage into our waterways each year, and investing in innovative stormwater runoff solutions like drain filters and green infrastructure.”DSC04553cropped

By comparison, the same NRDC report found that Westchester County in New York lost 112 beach days in 2012, and that New York State ranked 22nd out of 30 states, up from 24th in 2011.

Two Westchester County beaches had the first- and third-worst records in the state for the number of water samples that exceeded the state bacterial standard. Bacterial levels at Shore Acres Club in Mamaroneck tested above the standard fully 50 percent of the time, and Surf Club in New Rochelle exceeded 35 percent of the time. Overall, Westchester County beach samples exceeded the standard 14 percent of the time, making Westchester the fourth-worst tested county in New York. Bronx County, which also affects water quality in the western Sound, came in at number three.

Save the Sound issues weekly Sound Swim Alerts for Connecticut and Westchester County to inform residents when beaches are open for swimming and when they are closed. The alerts can be found on Save the Sound’s blog.

beach chart

Additional info on water pollution, contamination and depletion.