Exodus: Connecticut Ranked #1 in People Moving From State

Connecticut residents are on the move.  Out.

The state led the nation with the highest percentage of outbound moves in 2013, according to Atlas Van Lines’ annual report of moves throughout the U.S. and Canada. Of 2,055 residents' moves during the year, 1,230 of them, or 60 percent, were out of state – the highest percentage in the nation.  That's compared to 825 moves from other states into Connecticut.new_atlas_logo

A year ago, Connecticut was #7 in the nation in the ratio people moving out-of-state, with 1,123 outbound and 834 inbound moves, in a survey by United Van Lines.  This year, Connecticut led the nation in outflow of residents in the Atlas Van Lines survey.

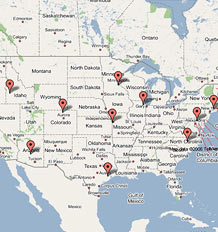
us moving mapDuring the past five years, inbound moves peaked in 2010 at 1,009 – with a just slightly higher  1,160 outbound moves.  Since then, the numbers have skewed increasingly out-of-state, Atlas reported.

The 2013 year was the state's highest outbound percentage and highest total number of outbound moves since 2009.  Connecticut has been an outbound state for six of the past ten years, including the past three consecutively, according to Atlas.  An “outbound” state is defined as one that has more than 55 percent of moves outbound.

The remainder of the New England states were "balanced" in 2013, with the exception of New Hampshire, which was considered an inbound state in 2013. The data indicates that progressively fewer people were moving into Connecticut in the last three years, a pattern not consistent throughout New England.  None of the other New England states were outbound states in 2013.  In the previous year, Maine joined Connecticut as an outbound state in the United Van Lines survey.

States that saw the greatest percentage of inbound movers: North Dakota, North Carolina, and Texas.  States with the highest outbound move percentage after Connecticut were New York and Indiana, both at 59 percent.  Only 12 states were net outbound states:  Connecticut, New York, Indiana, Wyoming, Delaware, Nebraska, Minnesota, Illinois, Indiana, Ohio, Pennsylvania, and New Jersey.Connecticut

The Greenwich Time reported that the branch manager of Danbury's Certified Van Service of Connecticut say, his truckers – part of the United Van Lines company - relocated about 100 families from the Hartford area to Charlotte, N.C., and from Fairfield County to Atlanta. For Kevin Kaster, president and owner of Kaster Moving in Stamford, the study confirms one trend he's recently experienced.  "Texas has been a hotspot the last two years, no question," he said. "An inordinate amount of people from around here are going to Texas."  Brielle Sollinger, aoutboundssistant marketing manager at Fallon Moving and Storage in Windsor, agreed.   "Texas is big. We also do lots of Virginia, North Carolina and South Carolina," she said in a phone interview Friday afternoon.

Atlas reported that across the nation, most states were balanced evenly between inbound and outbound moves. The company also reported that the number of total moves increased during the year, something it said could be an indicator of an improving economy.  The data covered the period from January 1 through December 31, 2013.

Connecticut Ranks #42 in Population Gain Between 2010 and 2013; New England Lags Nation

Connecticut’s population grew six-tenths of one percent between 2010 and 2013 according to estimates by the U.S. Census Bureau, ranking the state 42nd among the nation’s 50 states in population growth.  The state population, which was 3, 574,097 at the 2010 U.S. Census was estimated at 3,596,080 as of the official July 2013 estimate, announced at year’s end.

The 2013 estimates also show the nation's population grew by 2.4 percent in the three years since the 2010 Census, with the South and the West leading the expansion. The total for the 50 states, the District of Columbia and Puerto Rico rose from 308,745,538 in 2010 to an estimated 316,128,839 in July 2population graphic013.  Only Rhode Island lost population (1,056 people) during the period, and the Southern and Western states accounted for more than 80 percent of the growth nationwide.

The bottom twelve states in population growth – all under one percent - include five from New England:  Rhode Island, Maine, Vermont, New Hampshire and Connecticut.  The remainder are in the Mid-West.  Massachusetts population grew by 2.2 percent, New Jersey by 1.2 percent, and New York by 1.4 percent.

The South, the nation's largest population center, also had the highest percentage-point growth at 3.3 percent: CT populationfrom 114,555,744 in 2010 to an estimated 118,383,453 in 2013. The West was close behind, with a 3.2 percentage-point growth during the period, from 71,945,553 in the 2010 Census to an estimated 74,254,423 in July 2013.

The Midwest region had the smallest growth, at 0.9 percent: 66,927,001 people in 2010 to 67,547,890 in 2013, according to published reports. The population growth for the Northeast was 1.1 percent between 2010 and 2013, growing from 55,317,240 in 2010 to 55,943,073, according to the census estimates.

The bottom twelve, including Connecticut, saw increases of less than one percent, including Rhode Island’s drop in population, and Maine standing essentially even, adding less than 1,000 people.

  • Rhode Island -0.1people
  • Maine   0.0
  • Michigan 0.1
  • Vermont 0.1
  • West Virginia 0.1
  • Ohio 0.3
  • Illinois   0.4
  • New Hampshire 0.5
  • Connecticut 0.6
  • Pennsylvania 0.6
  • Mississippi 0.8
  • Missouri 0.9

The new figures from the Census Bureau shows Massachusetts is continuing to add to its population. The latest estimate as of July 1 puts the state's population at nearly 6.7 million, up by more than 47,000 from July, 2012.  Massachusetts' ranking is the 14th most populous state in the country.

New York remains the third most populous state in the nation -- behind California and Texas -- but the state's lead over fourth-place Florida continues to erode, according to 2013 population estimates. New York saw an increase of 1.4 percent from 19,378,102 people in the 2010 Census to 19,651,127 in the 2013 estimate, according to the bureau.

Florida's population in the 2010 Census was 18,801,310, about 576,000 fewer than New York's 2010 Census population. However, Florida's population rose an estimated 4 percent between 2010 and 2013, to 19,552,860 -- about 98,000 fewer than New York's 2013 population estimate.  Some have projected that Florida will overtake New York in population next year.

North Dakota, with its expanding oil and gas industry, led the growth chart between 2010 and 2013, at a 7.6 percent clip, including a 3.1 percent population increase in just the past year.

For the 12 months ending July 1, 2013, population growth nationwide was 0.71%, or just under 2.3 million people. That's the slowest since 1937, USA Today reported.  An aging Baby Boomer population and slower immigration combined for what the newspaper described as “nearly stagnant U.S. population growth,” the slowest pace since the Great Depression.

Maine and West Virginia were the only two states to lose population between 2012 and 2013.  The Census Bureau estimates that Connecticut picked up 4,315 residents in that 12-month period.

Task Force Report on State Response to Alzheimer’s Nears Completion

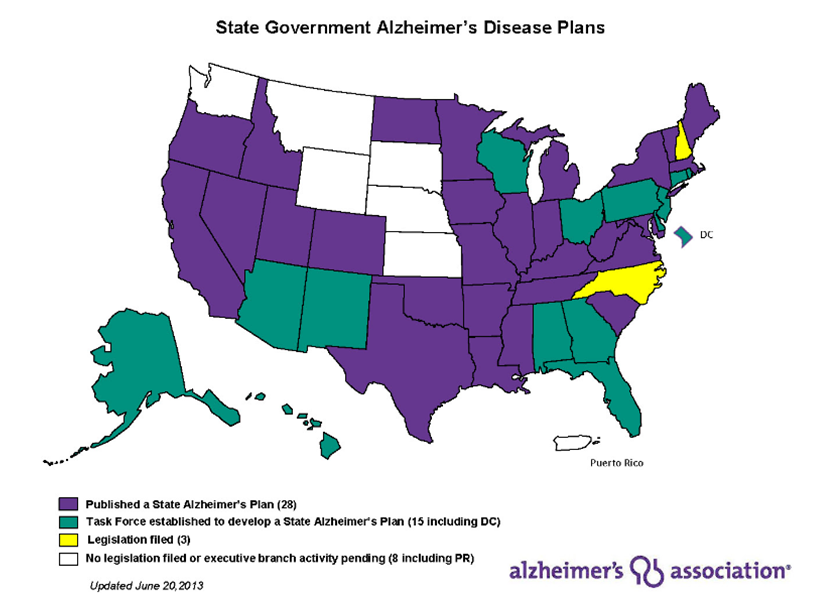
Thirty-one states have published a plan to respond to what advocates describe as the “escalating crisis” of Alzheimer’s Disease. Connecticut may be next, and is one of 13 states currently in the midst of developing plans.

The Connecticut Chapter of the Alzheimer’s Association was among the leaders in crafting and shepherding legislation in the 2013 General Assembly session to create a task force to study the care provided to persons diagnosed with Alzheimer's disease and dementia in the state.  That Task Falzheimers-wordsorce has been up and running throughout the fall, and is poised to announce its recommendations next month, just ahead of the start of the 2014 legislative session in February.

The 23-member task force of key agencies and community stakeholders convened in September, under the auspices of the Legislative Commission on Aging, to prepare findings and recommendations on ways to improve early detection, better coordinate health care services, set training requirements for health care providers and other professionals, services for early-stage and younger onset, and support to family caregialz mapvers.

The Task Force was co-chaired by State Commissioner on Aging Edith Prague and Rep. Joseph Serra of Middletown.  Members included Laurie Julian of the Alzheimer’s Association in Connecticut and other diverse community stakeholders appointed by legislative leadership and representatives from state agencies including the Department of Public Health, Department of Emergency Services, Department of Banking, Department of Labor and Department of Social Services, as well as six current legislators.

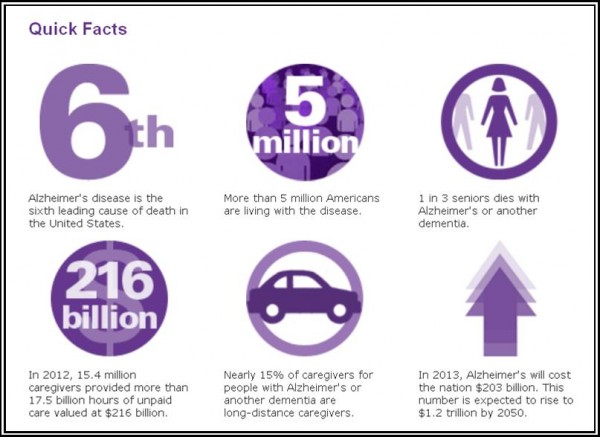
Over 5 million Americans are living with Alzheimer’s, and as many as 16 million will have the disease in 2050. Nearly one in every three seniors who dies each year has Alzheimer’s or another dementia. The cost of caring for those with Alzheimer’s and other dementias is estimated to total $203 billion in 2013, increasing to $1.2 trillion (in today’s dollars) by mid-century. Between 2000 and 2010, nationally, the number of people who died as a result of breast cancer, prostate cancer, heart disease, stroke and HIV all declined, while the number of people who died with Alzheimer’s increased by 68 percent.

In Connecticut, there were 820 deaths due to Alzheimer’s Disease in 2010, there are more than 63,000 individuals with Alzheimer’s in nursing homes in the state and it is estimated that 68% of nursing home residents have a cognitive impairment. As of 2010, there were an estimated 2,800 people between age 65-74 with Alzheimer’s in Connecticut, 30,000 between 75 and 84, and 37,000 age 85 or older.

The task force, in accordance with the legislation, will make recommendations in areas including:alz stats

  • services provided to persons diagnosed with Alzheimer's disease and dementia; including persons with early-state and early-onset of Alzheimer's disease, and such persons' family members and caregivers
  • legislative policy changes to better serve such persons, family members and caregivers;
  • coordination between state agencies and private community-based health care providers to serve such persons, family members and caregivers;
  • case management services for such persons, family members and caregivers;
  • the transition of such persons from one health care facility to another; and
  • the placement of such persons in community-based settings or health care facilities other than nursing home facilities, when feasible.

The state legislature acknowledged the growing numbers of residents impacted by the disease, passing the bill unanimously earlier this year, with 67 co-sponsors. It was signed into law in June by Gov. Malloy.  The Alzheimer’s Association has been actively involved in the effort. The organization’s   Connecticut chapter is based in Rocky Hill, with regional offices in Hamden, Norwalk, Norwich and New Milford.

In accordance with the legislation, the task force report is due to be published early next month, according to officials at the State Legislative Commission on Aging.


18 Connecticut School Districts Named to Advanced Placement Honor Roll

Eighteen Connecticut school districts have been named to The College Board’s 4th Annual AP District Honor Roll — a list of 477 districts across the U.S. and Canada being honored for increasing access to AP (Advanced Placement) course work while simultaneously maintaining or increasing the percentage of students earning scores of 3 or higher on AP Exams.

Reaching these goals indicates that these districtsAP district are successfully identifying motivated, academically prepared students who are likely to benefit from rigorous AP course work, according to The College Board.

The Connecticut school districts include public schools in Berlin, Brookfield, Cheshire, Clinton, East Hampton, Ellington, Enfield, Fairfield, Greenwich, Killingly, Monroe, Newtown, Southington and Wallingford, as well as Regional School Districts 8 (Hebron, Andover, Marlborough), 14 and 18 and the Diocese of Bridgeport.

Most of the districts had received similar recognition in previous years; new to the list are Wallingford, Regional Districts 14 (Woodbury and Bethlehem) and 18 (Lyme and East Lyme), Killingly, Greenwich, Clinton, Fairfield and Enfield and the Diocese of Bridgeport. A year ago, there were 26 Connecticut school districts recognized on the AP District Honor Roll.

 AP is a rigorous academic program that offers more than 30 courses in a wide range of subjects and college-level assessments developed and scored by college and university faculty members and experienced AP teachers. According to the College Board, a score of 3 or higher on an AP exam represents the score point that is predictive of college success and college graduation. The AP courses offered various by school dstudents hsistrict, but often include biology, chemistry, physics, Spanish, U.S. history, English literature, and calculus.

Helping more students learn at a higher level and earn higher AP scores is an objective of all members of the AP community, from AP teachers to district and school administrators to college professors, officials at The College Board point out. They noted that many districts are experimenting with a variety of initiatives and strategies to determine how to simultaneously expand access and improve student performance.

Inclusion on the 4th Annual AP District Honor Roll is based on the examination of three years of AP data, from 2011 to 2013, for the following criteria.

  • Increased participation/access to AP by at least 4 percent in large districts, at least 6 percent in medium districts, and at least 11 percent in small districts;
  • Increased or maintained the percentage of exams taken by African American, Hispanic/Latino, and American Indian/Alaska Native students, and;
  • Improved performance levels when comparing the percentage of students in 2013 scoring a 3 or higher to those in 2011, unless the district has already attained a performance level at which more than 70 percent of its AP students are scoring a 3 or higher.

In 2013, more than 3,300 colleges and universities around the world received AP scores for college credit, advanced placement and/or consideration in the admission process, with many colleges and universities in the United States offering credit in one or more subjects for qualifying AP scores.

Regional School District 14’s Superintendent, Jody Ian Goeler said, “It is wonderful to see so many of our High School students challenging themselves to take and succeed in our most rigorous courses. It is a strong indication our Board of Education’s advocacy for these programs is well placed and providing excellent opportunities and results for our students.”

Greenwich High School Principal Chris Winters recently commented that “Our participation in AP  classes is at a 10-year high, and the average score has remained unchanged and at very high levels. For the first time, over 50 percent of Greenwich High School have passed at least one AP exam during their four years.”

Nationwide data from 2013 show that among African American, Hispanic, and Native American students with a high degree of readiness for AP, only about half of students are participating. These 477 districts, The College Board indicated, are committed to expanding the availability of AP courses among prepared and motivated students of all backgrounds.

Percentage of Drivers Age 85 and Older: Connecticut Leads USA

Connecticut has more than double the percentage of licensed drivers age 85 and older than any other state in the nation, according to data compiled by Bloomberg.

In the Land of Steady Habits, 5.1 percent of all drivers – a total of 152,233 people – were age 85 or older, ranking Connecticut at the top of the state-by-state ranking.  The second place state, Maine, had 2.34 percent of its licensed drivers in that demographic.

The Insurance Institutolder driverse for Highway Safety reports that 29 states and the District of Columbia have additional license renewal procedures for older drivers, often age 65 or 70 and older.  In Connecticut, people 65 and older may choose a 2-year or 6-year renewal cycle. A personal appearance at renewal generally is required. Upon a showing of hardship, people 65 and older may renew by mail. There are no additional requirements for older drivers, according to the Insurance Institute.

Bloomberg ranked the U.S. states and the District of Columbia on the percentage of licensed drivers ages 85 and older, using data from the Federal Highway Administration.  (The data was for 2011, the most recent year available.)

The Age 85+ Rankings (percent of licensed drivers)elderly-driver

  1.  Connecticut        5.10%
  2. Maine                   2.34%
  3.  Alabama              2.23%
  4. Vermont              2.22%
  5.  Minnesota          2.11%
  6. New York            2.09%
  7. Nebraska             2.02%
  8.   South Dakota     1.99%
  9.  Florida                  1.98%
  10. Pennsylvania     1.98%

Rhode Island ranked #11, New Jersey was #15, Massachusetts was #17 and New Hampshire was #28 among states in our region.

Although they only account for about 9 percent of the population, National Highway Traffic Safety Administration statistics show senior drivers account for 14 percent of all traffic fatalities and 17 percent of all pedestrian fatalities, ABC News reported last year.

The network cited a report by Carnegie Mellon University in Pittsburgh and the AAA Foundation for Traffic Safety that found the rate of deaths involving drivers 75 to 84 is about three per million miles driven – on par with teen drivers. Once they pass age 85, vehicular fatality rates jump to nearly four times that of teens.  The Insurance Institute reports that the increased fatal crash risk among older drivers is largely due to their increased susceptibility to injury, particularly chest injuries, and medical complications, rather than an increased tendency to get into crashes.

An Institute study of a Florida vision test requirement for drivers 80 and older found that 80 percent of those eligible to renew their licenses attempted to do so, and 7 percent of them were denied renewal because they failed the vision test. Of those who did not seek renewal, about half said they thought they would fail the vision test.

CT State Employees: More Women Than Men, Mostly Middle-Aged

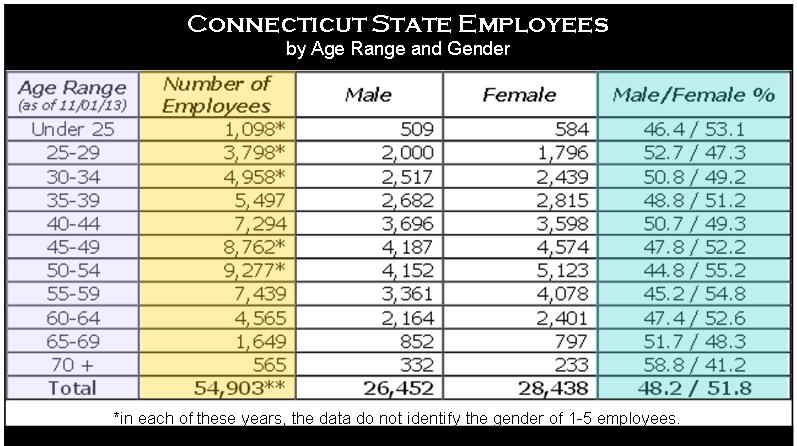
Of Connecticut’s 54,903 state employees in 2013, most were female, and between 40 and 60 years old, according to new demographic data released by the Office of Legislative Research based on information provided by the Office of State Comptroller’s CORE-CT data management system.

The breakdown comes just after indications that sCT state employeestate governments across the country are growing at a considerably slower rate than the private sector – which is true in Connecticut as well, where public sector jobs have been shed in recent years.

According to the state employee data:

  • Female state employees outnumber male state employees by 1,986
  • There are 9,277 employees aged 50 through 54 – the largest age group of state employees. 55% of them are female
  • 60%of state employees are between 40 and 60 years old.
  • 53% of the employees between 40 and 60 are female
  • 50.2% of state employees under 40 are male
  • 4% of state employees are age 65 or older
  • 58.8% of state employees age 70 and over are male.

The data includes employees of all three branches of government, higher education institutions, and quasi-public agencies.

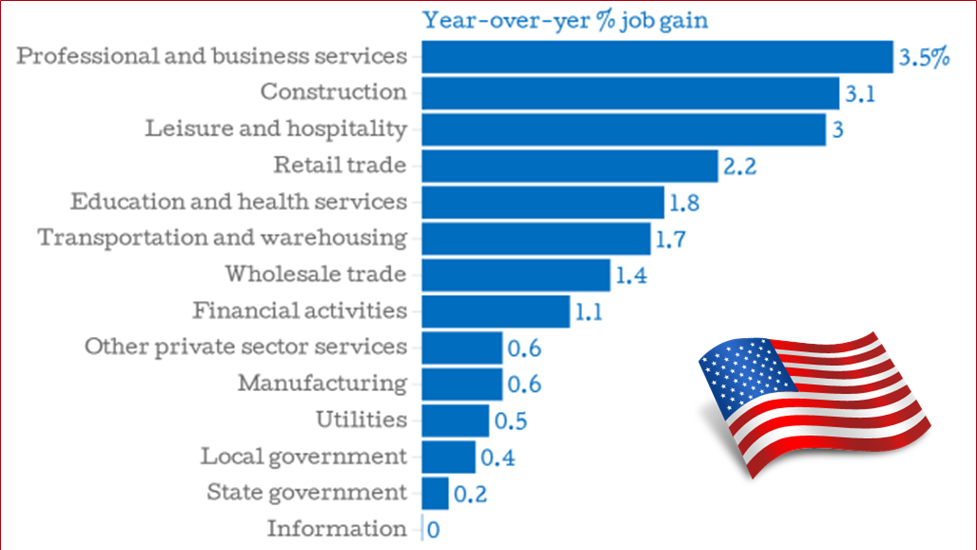
Earlier this month, GOVERNING magazine reported that there hasn’t been much growth in the government sector nationwide – both federal and state governments – even as other sectors of the economy are reflecting positive growth as compared with a year ago.

A few of the nation’s larger industries have fared better than others, such as professional and business services (+3.5 percent) and construction (+3.1 percent). Total non-farm employment increased by 1.7 percent. Picture1

Meanwhile, state and local government employment hasn’t budged, the magazine reported, increasing just 0.2 and 0.4 percent, respectively. The federal government has shed an estimated 92,000 positions, a reduction of 3.3 percent.  The Labor Department reported this month that the national unemployment rate fell to 7 percent in November – a five-year low.

In Connecticut, it has been widely reported that state government had about 1,200 fewer full-time equivalent positions mid-year 2013, compared with January 2011.

Charts:  Office of Legislative Research, GOVERNING magazine

Developing Downtown Housing Above Commercial Space Brings Obstacles, Opportunities, New CT Report Finds

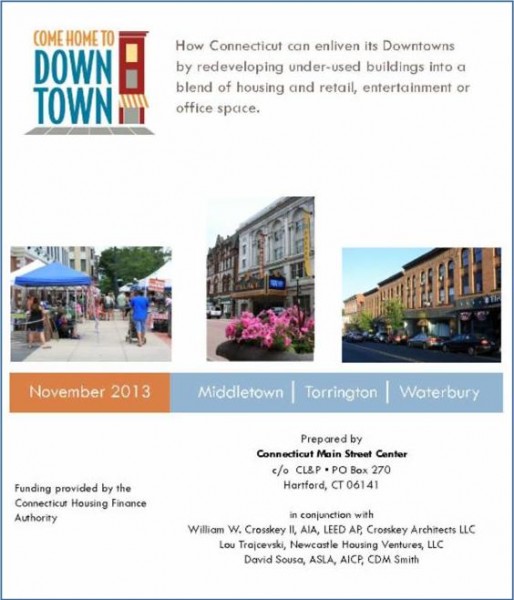
Connecticut's downtowns have a wealth of potential to redevelop under-utilized buildings into housing above commercial space - if mixed-use development can be encouraged through financing and favorable regulations, according to a new report from the Connecticut Main Street Center (CMSC).

The report comes at the conclusion of the first year of Come Home to Downtown, a pilot program CMSC established to encourage and facilitate viable, interesting housing opportunities while revitalizing downtown neighborhoods.  The initiative was contracted by the Connecticut Housing Finance Authority (CHFA) to promote housing in Connecticut's downtowns.

Three communities - Middletown, Torrington and Waterbury - as well as three property owners and their buildings, were selected as the focus of the program’s inaugural year. CMSC chose buildings typically found throughout Connecticut so they could serve as models for other towns. As a result, most of the findings expressed in the report apply to any Connecticut downtown wishing to maximize the potential of its existing infrastructure.Come-Home-logo-150x150

Among the key findings, the report indicates that mixed-use development is among the most challenging, and private owners are often in a “catch-22” as they seek financing.  Downtown management capacity is critical to the success of mixed-use development, the study found. In addition, the CMSC report explains that even when zoning regulations promote redevelopment, they are often not enough to enable mixed-use growth and a severe lack of financing impedes the growth of much-needed mixed use development.

"CMSC's report provides insights that will guide future housing development on Main Streets across Connecticut. The first year of the Come Home to Downtown program is not only creating opportunities to establish new rental housing in downtown neighborhoods, it's creating a model for other communities to follow,"   said Eric Chatman, President & Executive Director of CHFA, which has contracted with CMSC for a second year of the pilot program, which will focus on finding and creating financing.

The report's seven key findings are:

1. There is a huge amount of potential for accommodating mixed-use development - which both saves and generates monies - in Connecticut's downtowns. According to the U.S. Environmental Protection Agency, the infrastructure costs to service compact, dense development like that found Downtown reportin mixed-use neighborhoods are one-third to one-half lower than in suburban areas. It has been estimated that every downtown in Connecticut has at least one building that is under-utilized, containing a store or restaurant on the first floor, but with upper floors that are vacant or used for storage that could instead generate income if converted to apartment homes.
2. Mixed-use development is one of the hardest types to accomplish. There are several reasons why this is the case: these buildings are usually older and in need of greater rehabilitation; they are in need of complex financing from multiple sources; combine several uses in one building (such as housing and retail space); and are often owned by people with little to no redevelopment experience.

3. A severe lack of financing impedes the growth of mixed-use development. Because these deals are so intricate and multi-faceted, financing for the total development costs rarely exists from traditional sources.

4. Education and outreach to owners of possible mixed-use property is needed. Property owners are often unprepared for the complex process of redeveloping their building and unaware of the potential benefit in doing so. Very often, they also need assistance learning how to become landlords and attract good tenants.

5. Private-owners are in a catch-22 when it comes to obtaining financing. With regard to apartment homes located in mixed-use buildings, private owners can either apply for subsidies if they place income/affordability restrictions on the apartments, or the units are not restricted, but there is no subsidy for apartments at the same rental rate.

6. Even when zoning regulations promote redevelopmmiddletownent, they are often not enough to enable mixed-use growth. Favorable zoning regulations are important, but they cannot create mixed-use development by themselves. Each of the pilot communities had zoning policies that allowed for buildings with a mix of uses - a practice which should be commended and encouraged - but there were still significant impediments to promoting this type of growth. In addition, lessening current on-site parking requirements as a whole will also help promote housing in our downtowns.
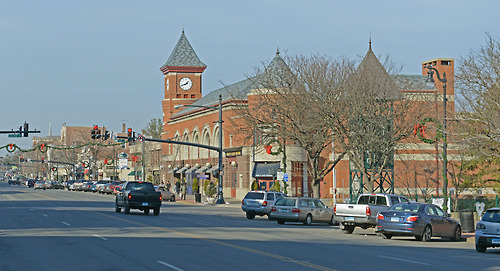
7. Downtown management capacity is critical to the success of mixed-use development. Any community interested in promoting revitalization of its downtown should consider enhancing its management function by becoming a resource center for mixed-use development, including convening key stakeholders, collecting data, offering education and information and coordinating development incentives.

"There is now a better understanding of what the next steps need to be, and a greater appreciation of the importance of the public-private partnership that is necessary to overcome the challenges and achieve reuse of these properties," Rose Ponte, Torrington's former Director of Economic Development, said about the new report.

 Engaging an expert team of consultants, CMSC worked with municipal officials and the building owners to develop viable redevelopment options including: determining what financing would likely be needed for redevelopment; performing an assessment of zoning and regulatory requirements; reviewing the downtown management function; and measuring the downtown's walkability. Specific recommendations for improving the buildings, including a recommended floor plan designed to attract new residents and bring market rate housing downtown, was also provided to each property owner.

Once rehabilitated, these buildings will create 60 new units of rental housing in downtown Middletown, Torrington and Waterbury, as well as make approximately 25,000 square feet of commercial and retail space available. The total development cost to renovate all three buildings is estimated to be $11.4 million.

"You see it on an almost daily basis - news articles and reports showing the demand, especially among Millennials and Baby Boomers who want to live in walkable, interesting places. It doesn't seem to matter if the downtown is large or small, as long as they can live there and get around without a car to go to the movies, grocery store or coffee shop, that's where people want to be these days," said John Simone, CMSC President & CEO.

In the pilot program’s second year, CMSC will choose two new communities while continuing to work with the property owners and municipal officials in Middletown, Torrington and Waterbury.

Bridgeport-Stamford-Norwalk Above National Average in Sustaining Startups, Study Finds

A new report assessing trends in start-up companies in 40 major metropolitan areas in the U.S. over the past two decades has found that the Bridgeport-Stamford-Norwalk corridor has performed well compared with similar regions in weathering, and rebounding from, the national economic downturn’s impact on the level of start-ups.

The report by the Kauffman Foundation, “The Most Entrepreneurial Metropolitan Area?,” was recently presented to the U.S. Conference of Mayors on Entrepreneurship, the first such confestart uprence of municipal leaders devoted solely to exploring entrepreneurship.

In reviewing Metropolitan Statistical Areas (MSA) with a population of between 500,000 and one million people, the report found that the Bridgeport-Stamford-Norwalk MSA placed “toward the top of the group, consistently above the year-to-year changes.”  In addition, the data indicate that Bridgeport-Stamford-Norwalk “did not fall as far during the (economic) downturn, so it appears to have fared slightly better.”

The paper compared the trends in the 40 metropolitan areas with high numbers of start-up businesses to the significant national downwkauffman-details-logoard trend in overall new firm formation starting after 2006.  Nationally, the trend reversed and started to recover in 2011. No metropolitan area escaped this downward trend, but there are differences among regions in the timing of the downturn and subsequent recovery.
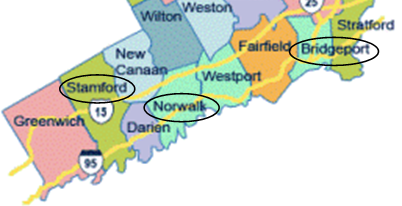
In counting the number of times that the annual percentage change in start-up density for each of the MSA’s, within the same size class, five of the MSA’s – including Bridgeport-Stamford-Norwalk – were “above average 12 times thorough the period” reviewed. The others to attain that “level of consistency” were Tulsa, OK; Omaha-Council Bluffs, NE-IA; Little Rock-North Little Rock-Conway, AR; and Knoxville, TN.

map

The report also found that the largest MSAs – those with populations greater than 1 million – fared slightly better through the recession and have experienced slightly stronger recoveries, though none has returned to pre-downturn levels.

The report compared MSAs with relatively larger populations and high startup densities from among the nation’s 366 MSAs.  The MSAs were divided into four groups for purposes of comparison, those with greater than 1 million population, those with 500,001 to 1 million, those between 250,000 and 500,000, and those smaller than 250,000.

The federal government’s Office of Management and Budget (OMB) provides official definitions for MSAs in the United States:  densely populated areas with close economic ties.

This Year, Brookfield, Cheshire, Simsbury Among Best Places to Live in America

The latest list of the best places to live in America, produced annually by Money magazine, places Sharon, MA atop the list, followed by Louisville, CO and Vienna, VA.  Three Connecticut towns made the list – Brookfield at #26, Cheshire at #39 and Simsbury at #50.

The annual published list varies from year to year because the criteria are not consistent.  A review of recent years indicates little overlap, as four Connecticut communities have made the list twice and eight others were “one and done,” not returning after a single appearance.

Overall, during the past four years, West Hartford has made the magazine’s list twice, in 2012 and 2010, as has Hamden, in 2012 and 2010, Simbest placessbury in 2013 and 2011, and Cheshire in 2013 and 2011.  Single appearances were made by Norwalk, Stamford, Portland, Tolland, Greenwich, South Windsor, Fairfield, and most recently, Brookfield.
Carmel, IN, McKinney, TX and Eden Mairie, MN and Newton MA led the list of “America’s best small cities” in 2012, with Connecticut’s Greenwich (#28), Hamden (#53), Fairfield (#64), and West Hartford (#72) earning a place on the list.

A year earlier, in 2011, the top ranked Connecticut community was Tolland at #37, followed directly by South Windsor at #38 and Simsbury at #39.  That year, Cheshire was #73 and Portland was #88, and the list was dubbed “Money’s list of America’s best small towns.”  In 2011, Louisville, CO was ranked first, followed by Milton, MA and Solon, OH.

In 2010, when Eden Prairie, MN topped the list and Newton, MA ranked third, the leading town in Connecticut among “America’s best small cities” was West static_mapHartford at #55.  The town was joined by Stamford at #78, Hamden at #87, and Norwalk at #90.
The highest ranking in recent years for a Connecticut community was Brookfield’s #26 this year, followed by Greenwich’s #28 last year.

The data for the published list is developed by Onboard Informatics, and the criteria and decision-making process is described on the CNNMoney website.

In 2013, the editors explained “we crunched the numbers in order to zero in on America's best small towns for families,” which included U.S. towns with populations of 10,000 to 50,000.   The previous year, “we looked at small cities, with populations between 50,000 and 300,000.”  In 2011, they investigated small towns, with populations between 8,500 and 50,000.  In 2010, the list was culled from a review of 800-plus U.S. cities with populations 50,000 and up.

In addition to the data compiled for the 2013 list, the magazine visited “36 towns and interviewed residents, assessed traffic, parks, and gathering places, and considered intangibles like community spirit,” according to the website.  The take-away from the visit to Brookfield, population 16,788?

“Surrounded by the largest lakes in Connecticut, Brookfield is a great spot for water recreation -- not to mention exploring lots of wooded hiking trails and open space. There are few employers right in town, so many residents commute within Fairfield County or to New York City, a 90-minute drive away.  While it is pedestrian-friendly, the town lacks a downtown. However, an area with residential and retail developments is under construction and should be completed within five years,” the website explained.

Connecticut Residents Are Extroverts, Neurotic and Open, National Study Finds

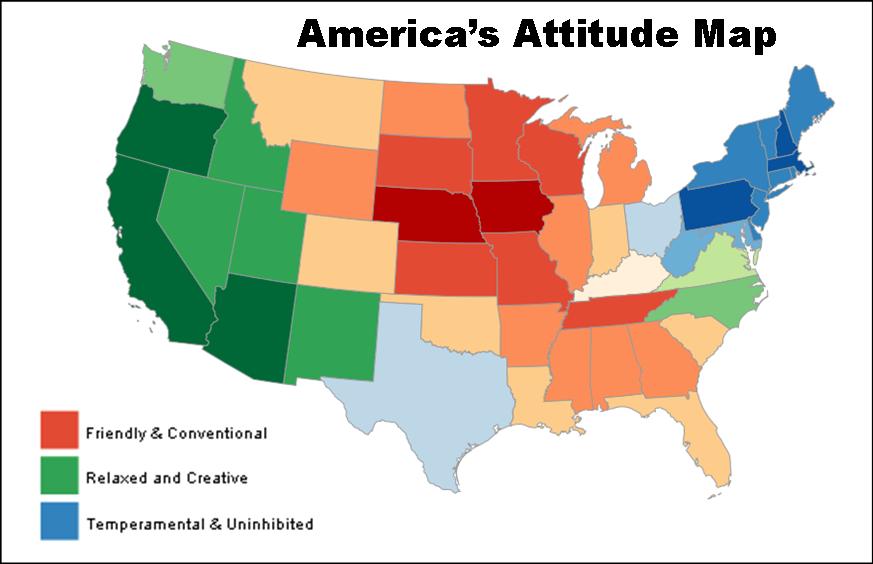
Connecticut ranks 47th among the states in conscientiousness, but #12 in extroversion and #16 in neuroticism, according to a new study published in a scientific journal and reported in TIME magazine.  Overall the state falls into the “temperamental and uninhibited” category, as does much of the Northeast, led by Vermont, Massachusetts and Pennsylvania.

Using personality test data from over one million people compiled over a decade, researchers identified three distinct personality regions in the country, and the degree to which each state reflected those characteristics.  The study was conducted by a multinational team of researchers led by psychologist and American expatriate Jason Rentfrow of the University of Cambridge in Great Britain.  big 5

The study, which maps the American mood state-by state, found that West Virginia is the most neurotic state, Utah is the most agreeable (Washington D.C. – not surprisingly – is the least agreeable) and the Wisconsin has the country's most extroverted residents. The most conscientious state in the nation?  That would be South Carolina.

The Connecticut Scoreboard indicates that state residents are above the national average in three characteristics - extroversion, neuroticism and openness, but lag in agreeableness and conscientiousness. (rank among states in parentheses; a score of 50 is the national average in each category:

  • Extroversion (12)  57.6
  • Neuroticism (16)  53.4
  • Openness (21)  53.9
  • Agreeableness (43)  38.6
  • Conscientiousness (47)  34.2

(sample size was 17,769)psp-150

The study, published in the Journal of Personality and Social Psychology, spanned 13 years and including nearly 1.6 million survey respondents from the 48 contiguous states and Washington, D.C.. (Alaska and Hawaii were excluded because not enough people responded to the researchers’ questionnaires.)

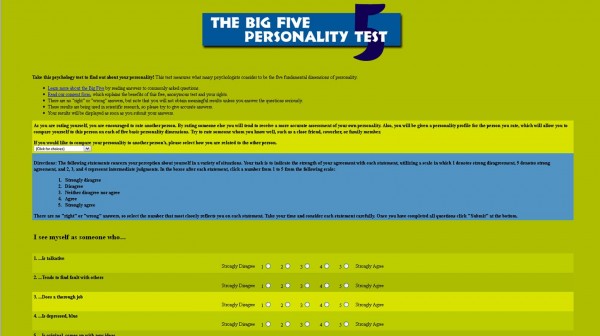
The subjects, recruited via websites and advertisements in the academic community as well as through platforms like Facebook, were asked to take one of three different personality surveys, though the most relevant one was what’s known as the Big Five Inventory, TIME reported. The survey measures personality along five different spectra: Openness, Conscientiousness, Extroversion, Agreeableness and Neuroticism.

(If you’d like to take the test, it is available online from TIME.)

Each of those categories is defined by more-specific personality descriptors, such as curiosity and a preference for novelty (openness); self-discipline and dependability (conscientiousness); sociability and Picture1gregariousness (extroversion); compassion and cooperativeness (agreeableness); and anxiety and anger (neuroticism). The inventory gets at the precise mix of those qualities in any one person by asking subjects to respond on a 1-to-5 scale, from strongly disagree to strongly agree, with 44 varied statements.

When the returns were tallied, TIME reported, the country broke down into three macro regions: New England and the Mid-Atlantic states, which the researchers termed “temperamental and uninhibited”; the South and Midwest, which were labeled “friendly and conventional”; and the West Coast, Rocky Mountains and Sun Belt, described as “relaxed and creative.”