

High Tech Firms Driving the National Economy; Connecticut Slowed as Other Regions Grew
/
If you’ve wondered why Connecticut has been devoting significantly increased economic development attention on high tech start-up businesses, encouraging and nurturing their development and offering financial incentives at every turn, a new national report on business start-ups in the sector may provide ample rationale.
High-tech startups are a key driver of job creation throughout the United States, according to research by technology policy coalition Engine and the E wing Marion Kauffman Foundation. The report, “Tech Starts: High-Technology Business Formation and Job Creation in the United States,” finds that high-tech startups are springing up at a higher rate than all private-sector businesses – and in more places around the nation. A total of 384 metropolitan areas were analyzed, including four in Connecticut, using comprehensive data through 2010, the most recent available.
Relative to their share of firms in the economy, high tech is 23 percent more likely, and the ICT sector (Information and Communications Technology), as a segment of high tech, is 48 percent more likely, than the private sector as a whole to witness a new business formation.
 Though they start lean, new high-tech companies grow rapidly in the early years, adding thousands of jobs along the way, according to the study findings. In fact, high-tech startup job creation is so robust that it more than makes up for the job destruction from early-stage businesses failures – a key distinction from the private sector as a whole where job losses from early-stage failures turns this group into net job destroyers, the report indicated.
However, as the density of high tech firms has grown in metropolitan areas across the country, it has not happened in Connecticut, as data reveals a reduction in the density of high tech firms in the state’s major metropolitan areas during the past two decades. (The U.S. average is 1.0.)
New Haven-Milford’s start-up density went from 1.1 in 1990, when it was one of nearly 70 metropolitan areas above the national average, to .5 in 2010, while the ICT sector start-up density dropped from above average at 1.2 in 1990 to .5 twenty years later. The Norwich-New London metropolitan area reflects a drop from 1.1 to .8 in high tech start-up density and 1.1 to .9 in the ICT sector comparing 1990 and 2010.
The data indicate that the Hartford-West Hartford-East Hartford area reflected decreases from .9 high tech start-up densities in 1990 to .6 in 2010, and .8 ICT start-up density in 1990 to .7 two decades later. The Bridgeport-Stamford-Norwalk metropolitan region showed a drop from 1.4 to .9 in high tech start-up density over the 20 year period, moving from above to below the national average, and a parallel drop of 1.6 to 1.1 in ICT start-up density.
The website Engine, which collaborated in the report, observed that “Each of the high density metro areas has one of three characteristics, and some have a combination of them all: 1) They are well-known tech hubs with highly skilled workforces, 2) They have a strong defense or aerospace presence, and 3) They are university cities.”
The report noted that “”high-tech startups are being founded across the country fueling local and national economic growth…and are a pervasive force in communities throughout the country.” The Top 10 Metro Areas for High-Tech Startup Density (1990 and 2010 data):
- Boulder, Colo. (High-tech 4.0 to 6.3; ICT 4.7 to 6.1)
- Fort Collins-Loveland, Colo. (High-tech 1.0 to 3.2; ICT 1.1 to 2.6)
- San Jose-Sunnyvale-Santa Clara, Calif. (High-tech 3.0 to 2.6: ICT 4.4 to 2.9)
- Cambridge-Newton-Framingham, Mass. (High-tech 2.0 to 2.4; ICT 2.0 to 2.3)
- Seattle, Wash.
- Denver, Colo.
- San Francisco, Calif.
- Washington-Arlington-Alexandria, DC-Va.-Md.
- Colorado Springs, Colo.
- Cheyenne, Wyo.
"This report confirms the dynamism of the technology sector and its disproportionate contributions to the U.S. economy. It also underscores the need for policies that enable and support that dynamism," said Dane Stangler, director of Research and Policy at the Kauffman Foundation.
The report, released earlier this year, used data from the Business Dynamics Statistics (BDS) series, which is compiled by the U.S. Census Bureau and tracks the annual number of new businesses (startups and new locations) from 1976 to 2011. Ten of the 14 high-tech industries can be classified as information and communications technology (ICT), while the remaining four are in the disparate fields of pharmaceuticals, aerospace, engineering services and scientific research and development.
In explaining the report, Engine noted that “While high-tech firms start small, they scale rapidly in the early years. So much so that young high-tech firms--those aged one to five years--contribute positively to net job creation overall. The opposite is true across the private sector as a whole, where the substantial job losses stemming from early-stage business failures - about half of all firms fail in their first five years - make young firms as a whole net job destroyers. Even when we remove the job destruction from all early-stage firm failures, surviving young high-tech businesses create jobs at a rate twice that of surviving companies in the private sector as a whole.”
 During the past five years, inbound moves peaked in 2010 at 1,009 – with a just slightly higher 1,160 outbound moves. Since then, the numbers have skewed increasingly out-of-state, Atlas reported.
 ssistant marketing manager at Fallon Moving and Storage in Windsor, agreed. "Texas is big. We also do lots of Virginia, North Carolina and South Carolina," she said in a phone interview Friday afternoon.
 013. Only Rhode Island lost population (1,056 people) during the period, and the Southern and Western states accounted for more than 80 percent of the growth nationwide.
 from 114,555,744 in 2010 to an estimated 118,383,453 in 2013. The West was close behind, with a 3.2 percentage-point growth during the period, from 71,945,553 in the 2010 Census to an estimated 74,254,423 in July 2013.

 vers.
vers.
 are successfully identifying motivated, academically prepared students who are likely to benefit from rigorous AP course work, according to
  istrict, but often include biology, chemistry, physics, Spanish, U.S. history, English literature, and calculus.
 e for Highway Safety
 tate governments across the country are growing at a considerably slower rate than the private sector – which is true in Connecticut as well, where public sector jobs have been shed in recent years.
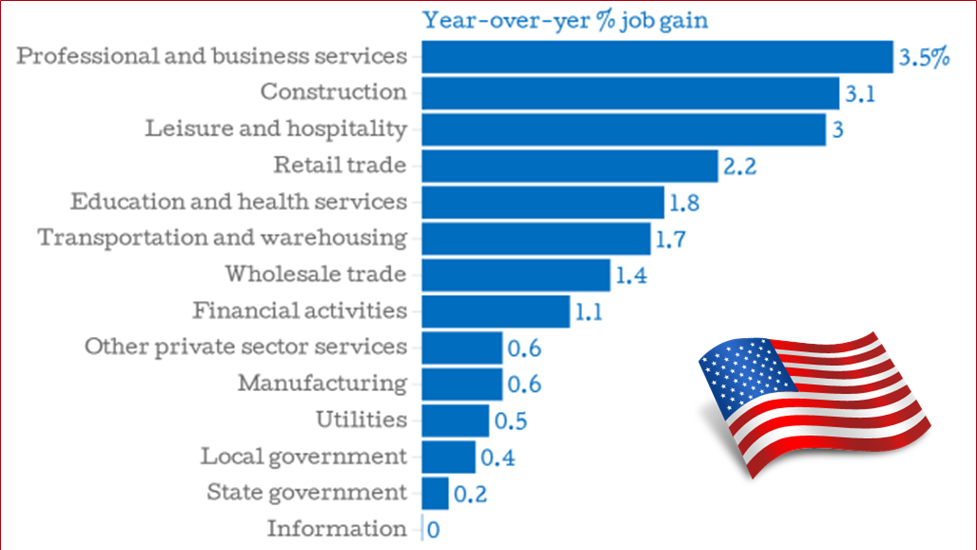
 in mixed-use neighborhoods are one-third to one-half lower than in suburban areas. It has been estimated that every downtown in Connecticut has at least one building that is under-utilized, containing a store or restaurant on the first floor, but with upper floors that are vacant or used for storage that could instead generate income if converted to apartment homes.
 ent, they are often not enough to enable mixed-use growth. Favorable zoning regulations are important, but they cannot create mixed-use development by themselves. Each of the pilot communities had zoning policies that allowed for buildings with a mix of uses - a practice which should be commended and encouraged - but there were still significant impediments to promoting this type of growth. In addition, lessening current on-site parking requirements as a whole will also help promote housing in our downtowns.
 rence of municipal leaders devoted solely to exploring entrepreneurship.
 sbury in 2013 and 2011, and Cheshire in 2013 and 2011. Single appearances were made by Norwalk, Stamford, Portland, Tolland, Greenwich, South Windsor, Fairfield, and most recently, Brookfield.
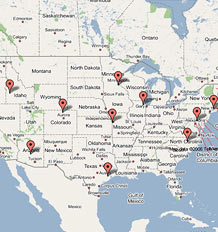 Hartford at #55. The town was joined by Stamford at #78, Hamden at #87, and Norwalk at #90.


