Land of Steady Habits: CT Ranks #37 in Divorce Rate

Connecticut’s divorce rate ranks the state #37 in the nation in the percentage of residents who are divorced.  According to the U.S. Census Bureau’s American Community Survey, 10.6 percent of state residents are divorced, 1.4 percent are separated, and 48.2 percent are married.

The highest divorce rate was in Nevada, at 14.6 percent.  Right behind Nevada are Maine (14.2 percent), Oklahoma (13.5 percent), Oregon (13.4 percent), Arkansas and West Virginia (13.3 percent), Florida and Kentucky (13.2 percent).

The lowest divorcDivorcee rates were in New Jersey, 8.6 percent, New York, 8.8 percent, and the District of Columbia, 9.2 percent.  Utah, Pennsylvania, and Hawaii were tied at 9.5 percent.

The state with the highest percentage of the population married was Utah, at 55.7 percent, followed by Idaho (55 percent) and Wyoming (52.9 percent).  Connecticut has the 31st highest percentage of married people among the states, at 48.2 percent.  The state was in a tie for 11th in percentage of population who were separated.

The U.S. Census data was from calendar year 2012, the most recent data available comparing states, and was reported by Bloomberg Visual Data.

Hartford as Global City: Immigrant Civic Engagement Initiative Gains Recognition

Hartford is quite an international city, a melting pot of cultures and backgrounds that most assume is the exclusive province of major metropolitan areas such as New York and Boston.  But in language, nation of origin, and cultural traditions, virtually every corner of the globe is represented in Connecticut’s Capitol City, and its surrounding communities.

In fact, Hartford is a popular resettlement city, with about 25 percent of the city’s population recent immigrants.  To respond to the significant need among the various immigrant communities for assistance and guidance in navigating language barriers and cultural differences and more fully integrating into their new home community, a partneHartfordPublicLibraryPicturership of Hartford-based organizations stepped up in a way that has proven quite effective, and is gaining national recognition.

The Hartford Public Library received funding in 2010 for an Immigrant Civic Engagement Project through the Institute of Museum and Library Services (IMLS), to develop a comprehensive program to promote immigrant civic engagement.  The initiative had two goals:globe

  • Facilitate the transition of newly arrived immigrants into the community and build trusting relationships of mutual understanding between new and longtime residents
  • Engage established immigrants in civic integration and facilitate their involvement in broader community building efforts

At the annual conference of the international Association for Research on Nonprofit Organizations and Voluntary Action (ARNOVA), hosted recently by Hartford and held at the Connecticut Convention Center, the leaders of the ground-breaking Hartford partnership were called upon to lead a session to outline their work for those who may seek to emulate it in other communities across the country.

Among the presenters was Richard Frieder, Director of Community Development & Civic Engagement within the Cultural Affairs & Public Programming Department and Center for Civic Engagement of the Hartford Public Library.  Frieder was joined by Homa Naficy, Chief Adult Learning Officer and Nancy Caddigan, Intercultural Liaison of the Hartford Public Library, and Kyle Barrette and Rebecca Thomas of the UConn School of Social Work.

Innovative Approaches, Impactful Outcomes

Their session, called “Innovative Approaches to Community Development in a Challenging Economy and Changing Society,” was well-received by conference participant from across the country.  They focused on “effectiveness, evaluation and programs,” outlining what was done and why – and how it all worked.

  • They described an effort that engages immigrants and “receiving” community members, social service providers and other immigrant advocates, highlighting the importance of building networks of trusting relationships.
  • The initiative provided an opportunity to address immigrant voices isolated from the mainstream, respond to language and economic barriers, and address the lack of engagement in community and civic associations.
  • The program featured “cultural navigators” – some of them bilingual - and community dialogues – held at the Library’s American Place - all aimed at improving the immigrant experience in Hartford.

Most of all, it created bonds between existing members of the community – many of them retired teachers and social workers who volunteered to be “cultural navigators” – and immigrants looking to adcivic engagementjust to their new land.

New connections were developed between city officials, organizations and service providers to the immigrant and refugee community, and both the immigrant community and receiving community became engaged in community building.  There was also outreach to churches, community centers and other neighborhood organizations.

Over three hundred people were involved across all activities of the three year project.

The outcomes were substantial, and included the development of strong relationships, an increased awareness of immigrant issues, integration of immigrant and refugee families within their local communities, and increased social capital for immigrant as well as receiving communities.  In addition, action teams focused on new community projects, municipal and organizational investment in immigrant and refugee issues was enhanced, and a City Commission on Immigrant Affairs was established.Hartford_CT

UConn School of Social Work students, as part of the grant-funded initiative, served as program evaluators, maintaining a rigorous evaluation of outcomes, and an audit trail of activities so that the entire project could be replicated.

At the end of the day, organizers hope that the program has effectively “changed the way that people think about immigrants – and the Capitol City.”  Hartford is a global community.  And it has produced a program that can help immigrants here and elsewhere to settle in and excel.

From Connecticut, Only Hartford Region Reaches Top 50 Best Cities for Job Growth

The rankings of Best Cities for Job Growth don’t place Connecticut’s major metropolitan areas  within reach of the top of the list.47

Among the nation’s large-sized cities, "Hartford-West Hartford-East Hartford" made the top 50, ranking at #47 in the latest list from the website newgeography.com.  Leading the 2013 list were metropolitan San Francisco, greater Nashville, and Salt Lake City.  The rankings used four measures of growth to rank all 398 metro areas for which full data sets were available from the past 10 years.hartford  The Hartford region dropped four slots from the 2012 rankings.

New Haven ranked at #65 among the medium-sized cities, just behind Fresno, California and Scranton-Wilkes-Barre, Pennsylvania.  Leading the list were Boulder, Colorado and Provo-Orem, Utah.  The highest ranked New England community was Framingham, Massachusetts, at #30.  The only other city from the region to reach the list was Springfield, Massachusetts, at #91.  65

Among the leading Small Cities, Danbury was the highest ranked in Connecticut at #111, with Waterbury at #223, and Norwich-New London at  #233, on a list of 241 small cities.  Topping the list were Midland and Odessa, Texas followed by Columbus, Indiana; Cleveland, Tennessee; San Angelo, Texas and Owensboro, Kentucky.

"Large" areas include those with a current non-farm employment base of at least 450,000 jobs. "Midsize" areas range from 150,000 to 450,000 jobs. "Small" areas have as many as 150,000 jobs. The rankings reflect the current size of each MSA’s employment. Only two MSAs changed size categories, with Honolulu, HI moving from “Midsized” to “Large” and Savannah, GA moving from “Small” to “Midsized.”

In the overall rankings, Bridgeport-Stamford-Norwalk was #348, Waterbury ranked #380, and Hartford placed at #229.  All the leading Connecticut metropolitan areas dropped in the rankings in 2013, compared with 2012.

NewGeography.com, based in North Dakota and California, is a site devoted to analyzing and discussing “the places where we live and work.”   It includes “insights on economic development, metropolitan demographics, and community leadership.”  cities

The index is calculated from a normalized, weighted summary of: 1) recent growth trend: the current and prior year's employment growth rates, with the current year emphasized (two points); 2) mid-term growth: the average annual 2007-2012 growth rate (two points); 3) long-term trend and momentum: the sum of the 2007-2012 and 2001-2006 employment growth rates multiplied by the ratio of the 2001-2006 growth rate over the 2007-2012 growth rate (two points); and 4) current year growth (one point). The rankings include all of the metropolitan statistical areas (MSAs) for which the Bureau of Labor Statistics reports monthly employment data.

newgeography.com Executive Editor Joel Kotkin is distinguished Presidential Fellow in Urban Futures at Chapman University in Orange, CA and an adjunct fellow with the Legatum Institute in London. He is author of seven books including his most recent, The Next Hundred Million: America in 2050 from Penguin Press and is affiliated with the Praxis Strategy Group and the Center for an Urban Future.

Wide-Ranging Actions Needed to Respond to Growing Alzheimer’s, Dementia Population in CT, Task Force Reports

In a 50-page report to the Connecticut legislature, the Alzheimer’s Disease and Dementia Task Force has outlined a series of 14 wide-ranging recommendations aimed at responding to the needs of a growing number of individuals and families facing the challenges of Alzheimer’s and dementia in Connecticut.

The recommendations include promoting public awareness and best practices including development of an education program for bank personnel, stepped-up dementia-specific training of health care professionals , court personnel and first responders, and improved support of informal caregivers.

The Task Force is urging “mandatory dementia-specific training for hospital emergency room staff, including nurses, physicians and medical technicians,” which may require legislation in the upcoming General Assembly session.  In addition, the Task Force – in another initiative likely to be the subject of legislation- calls for basic level of dementia training for public safety responders, long-term carcovere ombudsmen, protective service employees probate judges and court personnel.

Recognizing that “there are few Alzheimer’s and dementia training requirements for health care professionals and facilities,” the Task Force outlines a series of “detailed recommendations for dementia-specific training requirements across the continuum of care,” including home and community based services such as home health aides, homemakers and companions and personal care assistants.

The report also called for an analysis of the financial impact of developing a Dementia Centers for Excellence (COE) or geriatric assessment units at Connecticut hospitals.

The 25-member task force was formed by the legislature last year, and was administered by Connecticut’s Legislative Commission on Aging.  It was co-chaired by State Rep. Joseph Serra and Department on Aging Commissioner Edith Prague.  The Alzheimer’s Association of Connecticut worked with policymakers on introducing legislation that created the Task Force.  The Task Force met six times over four months, breaking into three subcommittees, which each met 4-6 times, to develop the final recommendations.  The committees focused on 1) Early Detection, Intervention and Planning, 2) Quality Care, Service Delivery and Care Management, and 3) Workforce Training and Development.

According to the Alzheimer’s Association, there are an estimated 70,000 individuals with Alzheimer’s or other dementia.  An estimated 60 to 70 percent of older adults with Alzheimer’s disease and other dementias live in the community, compared with 98 percent of older adults without Alzheimer’s disease and other dementias.  Of those, 75 percent live with someone and 25 percent live alone.  The recommendations also call for:

  • Creation of a public/community awareness campaign through partnerships with agencies and organizations including the Alzheimer’s Association, AARP and Area Agencies for Aging, as well as faith-based and immigrant communities, business/corporate associations, the medical community and resources such as 211.
  • Dissemination of informational packets to be distributed at doctor’s offices, pharmacies, senior centers and other locationsaging
  • Promotion of Medicare Annual Wellness visits which include a cognitive impairment assessment
  • Development of a “bank reporting project” which will train bank employees about “potential red flags” that indicate suspicious activity.  The reported noted that “cognitive impairment poses the most significant risk for exploitation, and bank personnel may be in a unique position to detect financial exploitation of older adult and individuals with dementia.”

To provide greater support for informal caregivers of individuals with dementia, the Task Force is urging development alzof a “train the trainer” dementia course based on the existing Alzheimer’s Association leaders’ training, and drawing on the model of the American Red Cross’ CPR training program to offer “accessible and affordable dementia education to caregivers.”

The Task Force is urging an increase in state funding to expand the Connecticut Statewide Respite Care Program, and to expand and set aside slots for individuals with younger onset Alzheimer’s disease in the Connecticut Home Care Program for the Disabled.

The report also would have the Department of Motor Vehicles “explore policies and regulations related to revoking drivers licenses” and calls on the agency to “take a proactive approach in educating physicians about reporting unsafe drivers to the DMV.” The Task Force also calls for establishment of a care manager registry at the Department of Consumer Protection, a new licensure model at the Department of Public numbersHealth for homemaker and companion agencies and collaborative initiatives with the Department of Social Services.

Julia Evans Starr, Executive Director of Connecticut’s Legislative Commission on Aging, said “It is well-documented that Alzheimer’s and related dementias exact a devastating toll not only on sufferers of the disease, but on the emotional and physical health of their caregivers. Sound public policies that help alleviate emotional and physical stress on affected individuals and their families are imperative, as well as giving these folks choices on receiving care in their communities rather than institutions.”

Dementia is an umbrella term describing a variety of diseases and conditions that develop when nerve cells in the brain die or no longer function normally.  Different types of dementia area associated with distinct symptom patters and brain abnormalities.  Alzheimer’s is the most common type of dementia, which causes problems with memory, thinking and behavior.  Over 5 million Americans of all ages have Alzheimer’s, including one in nine people age 65 and older (11 percent).  That number is expected to increase as the elderly population increases in the coming years.

Volatility Seen by High Net Worth Investors; Connecticut Views Differ From Region, Nation

Connecticut’s high net worth investors, coming off a year of substantial profits from Wall Street, remain optimistic, if cautious, about 2014.  There are, however, distinct differences in how and where they view investment opportunities, as compared with investors nationwide, and even compared with those in neighboring New York and New Jersey.

A newly released survey conducted for Morgan Stanley Wealth Management, found that high net worth investors – those with $100,000 or more in investable household financial assets – were both realistic and optimistic about the immediate investment horizon, according to Bradley Barber, Executive Director and Family Wealth Director for Morgan Stanley Wealth Management serving coastal Connecticut, based in Greenwich.Bradley Barber low res

The survey reflects “cautious optimism,” Barker said, indicating that investors understand that the 30 percent returns of 2013 are not likely to be repeated this year, but that potential remains for solid gains.  “It’s a time to navigate the waters, not pull in the oars,” Barber told Connecticut by the Numbers.  “It is a market of stocks, not a stock market.  The high net worth investors surveyed were prescient about the volatility in the market we’ve seen since the first of the year.”

In the New York-New Jersey-Connecticut region, 86 percent of high net worth individuals said they expect their investment portfolios to be “better” or “the same” at year-end, and 84 percent believe their financial well-being will be the same or better.  At the same time, three-quarters of respondents said they were concerned about stock market volatility.  Among the top concerns of investors in the region are U.S. economic prospects (86%) and the federal budget deficit (83%).

Views on Industry Investment Potential Vary

There were also marked differences in the perceptions of investment potential for various sectors of the economy.  Those most favored as “good” investments nationally were technology (79% nationally, 72% in CT), energy (77% nationally, 66% in CT), bio-technology (63% nationally, 67% in CT), and pharmaceuticals (56% nationally, 61% in CT).  Connecticut policy makers have devoted financial resources to strengthening the state’s bio-technology industry in recent years, which may have contributed to the stronger upbeat attitudes here towards the sector as an attractive investment option.

The rocky national roll-out of the affordable health care act, and its comparatively smooth path in Connecticut, may also have been reflected in the survey findings.  Unlike the national results, thosmorgan stanleye surveyed in the tri-state area viewed healthcare among the favored sectors for 2014 - 55% “good” in the tri-state region vs. only 45% nationally.

Other industry sectors that have a strong presence in the state and region, however, did not fare as well.  Aerospace was seen as a “good” investment choice by only 25 percent of those surveyed, both nationally and in the tri-state region.  Insurance was viewed favorably by only 30 percent of high net worth investors, both in the region and nationwide.  Those numbers, Barber said, should be “concerning” for Connecticut’s economic prospects.

Factors Close to Home of Greater Concern

Overall, the survey indicates that Connecticut’s high net worth investors have more concerns about internal factors, while New York residents expressed greater concerns regarding external factors, such as the possibility of terrorism or foreign entanglements.  Connecticut investors were more concerned than their regional and national counterparts with regard to their families’ financial well-being or the ability to have sufficient funds to retire in their region of the country.  While 53 percent of those in Atlanta and 59 percent nationally expressed concern over their families financial well-being, in the tri-state region seven in ten (70%) expressed that concern, with the highest numbers in the region in Connecticut.

optimisticConnecticut’s high net worth investors, Barber said, are a savvy lot, reflecting greater knowledge of investments than the national numbers reflect, yet more than 7 in 10 say they consult financial professionals.  Another clear distinction came in the percentage of investors who said dividend-bearing stocks are a good investment:  49 percent nationally, 61 percent in the tri-state area, and 71 percent in Connecticut.  “There are clear indications that Connecticut’s high net worth investors are focused on opportunity,” Barber said.

High net worth investors, overall, are bullish on America.  In the tri-state region 61 percent of those polled said the U.S. was their first choice for a positive investment outlook for 2014, even higher than the 52 percent who expressed that view nationally. There were also differences across the country in the issues of particular concern to high net worth investors.  Regarding terrorism, 82 percent in the tri-state area, 66 percent in San Francisco and 63 percent in Denver indicated concerns, for example.

As part of the national survey of 1,004 US investors, age 25 to 75, with $100,000 or more in investable household financial assets, an oversample of about 300 tri-state area investors were interviewed. Approximately one-third of those interviewed had $1 million or more in household financial assets. The poll, released on January 29, 2014, was conducted October through December 2013, by GfK Public Affairs and Morgan Stanley Corporate Communications.

Morgan Stanley Wealth Management provides access to a wide range of products and services to individuals, businesses and institutions, including brokerage and investment advisory services, financial and wealth planning, banking and lending, cash management, annuities and insurance, retirement and trust services.

Pay Inequality Gap Widens in Greater Hartford; 8th Largest in U.S. Since 2008

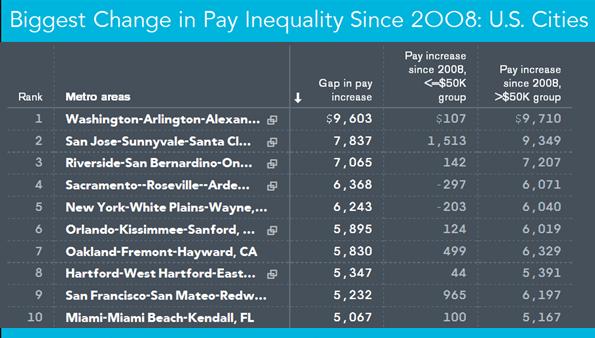
If you thought the earnings gap between the “have’s” and “have-nots” in the Greater Hartford region has been widening in recent years, new data indicates your impression is correct.  The Hartford-East Hartford-West Hartford region ranks #8 among the nation’s metropolitan areas with the largest widening gap in employee earnings, when comparing those making less than, or more than, $50,000. The data was compiled from the U.S. Bureau of Labor Statistics.

Between 2008 and 2013, the gap in the increase in pay between those earning less than $50,000 and those making more than $50,000 was $5,347 – the eighth largest gap in the nation.  The pay increase for the lower paid employees since 2008 was an averpay inequalityage of $44, compared with a $5,391 average increase among those earning more than $50,000.

In analyzing the data, Bloomberg ranked the 49 metro areas with the most employed people on the difference in pay since 2008 between those earning more than $50,000 and those earning $50,000 or less.  Occupations with both annual median pay and total employment numbers were included. On average, more than 500 occupations in each Metropolitan Statistical Area were studied.

The widest gap was in the Washington-Arlington-Alexandria metropolitan area, at $9,603, followed by San Jose-Sunnyvale-Santa Clara at $7,837, and Riverside-San Bernadino-Ontario at $7,065.  Also with a wider gap than the Hartford region were metropolitan Sacramento ($6,368), theearnings gap New York metropolitan area ($6,243), greater Orlando ($5,895) and metropolitan Oakland ($5,830).
The only big city in the U.S. where the gap between highest and lowest earners has narrowed since 2008 is Memphis, TN.

In the survey methodology, annual pay was employee-weighted and included base salary, cost-of-living allowance, guaranteed pay, hazardous-duty pay and incentive pay - commissions, production bonuses and tips. The analysis was released in December 2013, using the most recent data available.

Landlines Continue to Disappear in CT and Nationwide, New Federal Data Shows

One-fifth of all adults and one-quarter of all children under 18 living in Connecticut reside in households that have wireless telephones but no landlines, according to data compiled in the National Health Statistics Report.  For calendar year 2012, the most recent data available, 20.6 percent of adults age 18 and over and 25.4 percent of children under age 18 did not have a landline telephone in their home.

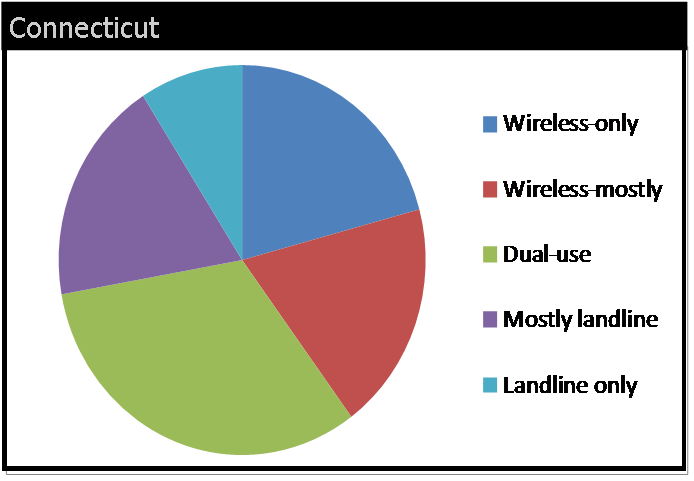
The report also indicates that in Connecticut, 20.6 percent of adults live in a wireless-only residence, 18.8 percent live in a mostly-wireless home, 32 percent live in a “dual-use” residence using both wireless and landline, 18.5 percent are mostly landline at home, and 9 percent have landline only.

Among children under age 18 in Connecticut, the growing dominance of mobile phones is evident, with nearly half in wireless-only (25.4 percent) or wireless-mostly (20.6 percent) households and 32.9 percent in dual-use residences.  Only 11.8 percent and 8.4 percent describe their household as being landline-mostlyphone pie or landline-only.

The National Health Interview Survey is the most widely cited source for data on the ownership and use of wireless telephones.  It is conducted by the Centers for Disease Control and Prevention’s National Center for Health Statistics, within the U.S. Department of Health and Human Services.

The report showed “great variation in the prevalence of adults living in wireless-only households across states.  Estimates for 2012 ranged from a high of 52.3 percent in Idaho to a low of 19.4 percent in New  Jersey.  Other states in which the prevalence of wireless-only adults was relatively high (exceeding 45 percent) were Mississippi (49.4%), Arkansas(49.0%), and Utah(46.6%).

Several other states in the northeascellphone survey health covert joined New Jersey with prevalence rates below 25 percent, including Connecticut (20.6%), Delaware (23.3%), New York (23.5%), Massachusetts (24.1%), and Rhode Island (24.9%).

Results showed a great variation in the prevalence of wireless-only children across states, ranging from  a high of 63.4 percent in Mississippi to a low of 20.6 percent in New Jersey.  Other states with a high prevalence of wireless-only children included Idaho (62.2%), Arkansas (59.8%), Missouri (55.2%), and South Carolina (54.5%). Other states with a low prevalence of wireless-only children included Vermont  (24.5%), Connecticut (25.4%), Alaska (25.7%), and Massachusetts (26.7%).

The 2012 state-by-state data was released by the NHIS in December 2013.  At the same time, the agency released composite national data for the first six months of 2013 that indicates 38.0 percent of U.S. adults lived in a household that has only mobile telephone service and no landline. As reported in the Huffington Post, their tracking shows that more than half of adults under age 35 and nearly two thirds (65.6 percent) of those ages 25 to 29 are cell-phone only.

The Pew Research Center, in a spring 2013 survey, found that ror the first time, cell phone ownership among adults has exceeded 90 percent. Cell phones are now being used by 91 percent of adults, according to the Internet & American Life Project survey conducted between April 17 and May 19 of 2,252 adults.2013-12-18-cdcnhiscellonly

UConn Applications Climb; Board of Regents Makes Commitments on Remediation at White House Summit

Who is attending college in Connecticut – and who is not – was the central topic of conversation in Storrs and at the White House Thursday.

At a White House summit on expanding college opportunity, the Connecticut State Colleges and Universities (ConnSCU) system was among more than three dozen colleges, universities and systems issuing promises of specific policy steps to be taken to improve college access and completion rates, with a particular focus on low-income students.   Connecticut Board of Regents President Gregory W. Gray was among those in attendance.

As part of the day-long summit, the White House released a 90-page “Commitments to Action” summary that included new commitments from over 100 colleges and universities and 40 organizations “to build on their existing efforts.”  The steps the institutions will be taking follow calls from President Obama, Education Secretary Arne Duncan and others to improve higher education opportunity in the United States, in response to the nation’s diminishing standing compared with other nations.

As education, business awhite hosuend nonprofit officials were meeting in Washington, the University of Connecticut, the state’s flagship institution, announced that the number of high school students seeking admission to UConn’s Storrs campus next fall has jumped significantly over last year’s figures, comprising a pool of potential freshmen with even higher average SAT scores and more diversity than previous years’ applicants.

More than 29,500 students applied as of Wednesday’s due date, a 10 percent increase over last year’s number, according to UConn officials. The number of minority applicants also increased by 16 percent – described as an important consideratiouconn-new-logon in UConn’s commitment to diversity.   Officials pointed out that the jump in UConn applications runs counter to national and regional trends in which declines in the number of high school graduates have caused many universities to see their applications and enrollments level off or decrease.

Enrollment Moving in Opposite Directions

The Board of Regents system – which includes more than 90,000 students attending the state’s 17 public colleges and universities (except UConn, which is outside the system) – has seen the largest drop in students among the state’s public and private higher education sectors. At Connecticut's four state universities (Central, Eastern, Southern, Western), enrollment was down 2.2 percent to 34,062 this year compared to 2012, reflecting the continued losses in the number of part-time graduate students. Enrolllogo-connscument at the community colleges fell 2.1 percent to 56,977, reflecting losses in both full and part time students.


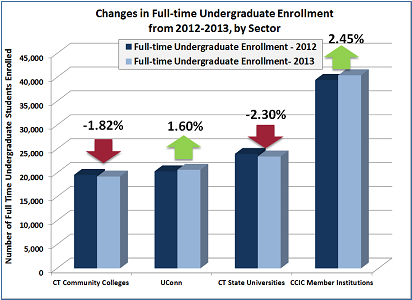
Full-time undergraduate enrollment among member institutions of the private Connecticut Conference of Independent Colleges (CCIC) rose by nearly 2.5 percent this past fall. In fact, nine of the 16 CCIC member institutions had an increase in enrollment and five of these institutions hit new enrollment records: Goodwin College, Quinnipiac University, Sacred Heart University, University of New Haven, and the University of Saint Joseph. In contrast, only five of twenty three public institutions showed an increase in enrollment.CCIC

According to Thursday’s newly released White House document, “Connecticut commits to planning an evaluation of pilot data to assess and improve upon efforts to implement remediation redesign throughout post-secondary institutions in the state.  Efforts will support improvements to remediation curriculum and practices on campuses.”  One of the panel discussion Thursday in Washington D.C. focused on the remediation issue, in which students graduating high school but not quite ready for college have traditionally taken non-credit bearing courses to prepare for college.

Focus on Remediation

The Connecticut legislature in 2012 passed a new law that requires public colleges to embed remedial education in credit-bearing courses, with extra tutoring and assistance for students who need remedial help. The bill had concerned some faculty at the institutions, who felt that abolishing all remedial classes would be unworkable, considering the learning deficiencies of some incoming students. Beginning with the Fall 2014 semester, the new law allows institutions to offer a student no more than one semester of non-embedded remedial support.

Connecticut wiCommitments to Actionll be hosting two upcoming events focusing on the remediation issue, the White House report indicated:
  • A“Multiple Measures Summit,” which will offer information and applicability of various methods of placement assessment for consideration of state community colleges and universities.
  • A “Remediation Conference,” which “will serve as an opportunity for state-wide collaboration outlining best practices of the piloting of intensive, embedded and transitional remedial education initiatives.  Data results will be shared along with ideas for scalability.”

The “Commitments to Action” document also notes that “The Board of Regents is currently conducting 139 pilots consisting of both math and English, intensive and embedded programming across the 17 ConnSCU institutions… Data will be analyzed by institution and system faculty/administration to highlight challenges for adaptation and strengths for duplication.”   It has been estimated that by 2020, 70 percent of Connecticut’s jobs will require post-secondary education.

Among UConn’s larger applicant pool, several stand-out programs – including engineering, business, digital media, and allied health sciences – are among the disciplines that saw significant increases in interest from the potential new UConn students who applied for admission.  With substantial financial support from the Governor and state legislature, UConn is investing in new faculty, updating its academic plan, and planning for the Next Generation Connecticut initiative to revolutionize its STEM (science, technology, engineering acollege enrollmentnd math) curricula.

UConn will begin notifying this year’s applicants with offers of admissions starting March 1, with the targeted new class of Storrs freshmen estimated to be around 3,550 students. The number of applicants has more than doubled since 2001, when the University received about 13,600 applications.

UConn’s Next Generation Connecticut initiative, a $1.5 billion 10-year state-funded investment, is expected to attract $270 million in research dollars, $527 million in new business activity, and fund the hiring of 259 new faculty members and the enrollment of an additional 6,580 undergraduate students, as well as the construction of new labs and facilities, expansion of digital media and risk management degree programs and development of student housing at UConn’s Stamford campus.

President Obama has set a goal of having the United States achieve the highest proportion of college graduates in the world by 2020.  The U.S., which was once ranked #1 in the world, has fallen from the top 10, and current projections indicate that decent will continue without corrective actions, such as those outlined by participants in the White House-led effort.

CT Ranked 23rd in Nation in Pay Equity; Women Earn 78 Cents to Men’s Dollar

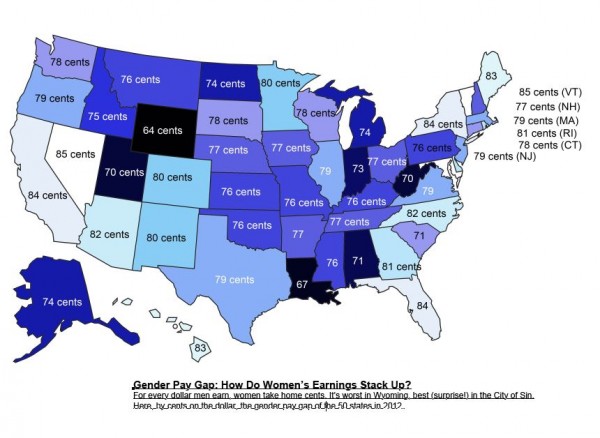
What do Connecticut, South Dakota, South Carolina, Wisconsin and Washington have in common?  The paycheck gap between women and men in the five states is identical – and ranked 23rd among the nation’s 50 states.  In Connecticut and the other four states, women, on average, receive 78 cents for doing equivalent work as men earning a dollar, according to an analysis published by Forbes magazine.ACS logo

The top states – with the smallest earnings gap differential - were Maryland, Nevada, Vermont (a three-way tie for first place), New York, California, Florida, Hawaii, and Maine.

For more than a decade, the comparison between the median earnings of full-time employed men and women in the U.S. has remained a stubborn 77 percent – that is, women earn roughly 77 cents on the dollar. A glimmer of prgender-pay-gap-graphic-finalogress is reflected in the total of 16 states in which women are now earning 80 cents or more to every male dollar, twice the count of 2010.

In Connecticut, just a penny above the national average, full-time annual earnings for women is $47,900; for men $61,097, according to the data.

Forbes analyzed data from the latest 2012 American Community Survey by the U.S. Census Bureau, using the mean earnings for full-time, year-round female workers by state.

Forbes pointed out that in Connecticut and New Jersey, both contiguous with New York, “women can expect healthy salaries—upwards of $47,000 as a median isn’t bad—but they earn 79 and 78 cents on the dollar respectively. Historically speaking, where there’s a large concentration of jobs in very high-paying occupations like finance, media and law, you’ll often (and unfortunately) find more men in those occupations than women which can skew the overall pay gap.”

The top 25 states:

  1. Maryland (tie-1st)
  2. Nevada (tie-1st)
  3. Vermont (tie-1st)
  4. New York
  5. California
  6. Florida
  7. Hawaii
  8. Maine
  9. Arizona
  10. North Carolina
  11. Georgia
  12. Delaware
  13. Rhode Island
  14. New Mexico
  15. Colorado
  16. Minnesota
  17. Texas
  18. Massachusetts
  19. Oregon
  20. Virginia
  21. New Jersey
  22. Illinois
  23. Connecticut
  24. Washington(tie-23rd)
  25. South Dakota(tie-23rd)
  26. Wisconsin (tie-23rd)
  27. South Carolina (tie-23rd)


High Tech Firms Driving the National Economy; Connecticut Slowed as Other Regions Grew

If you’ve wondered why Connecticut has been devoting significantly increased economic development attention on high tech start-up businesses, encouraging and nurturing their development and offering financial incentives at every turn, a new national report on business start-ups in the sector may provide ample rationale.

High-tech startups are a key driver of job creation throughout the United States, according to research by technology policy coalition Engine and the EKauffman reportwing Marion Kauffman Foundation. The report, “Tech Starts: High-Technology Business Formation and Job Creation in the United States,” finds that high-tech startups are springing up at a higher rate than all private-sector businesses – and in more places around the nation.   A total of 384 metropolitan areas were analyzed, including four in Connecticut, using comprehensive data through 2010, the most recent available.

Relative to their share of firms in the economy, high tech is 23 percent more likely, and the ICT sector (Information and Communications Technology), as a segment of high tech, is 48 percent more likely, than the private sector as a whole to witness a new business formation.

usa Though they start lean, new high-tech companies grow rapidly in the early years, adding thousands of jobs along the way, according to the study findings. In fact, high-tech startup job creation is so robust that it more than makes up for the job destruction from early-stage businesses failures – a key distinction from the private sector as a whole where job losses from early-stage failures turns this group into net job destroyers, the report indicated.

However, as the density of high tech firms has grown in metropolitan areas across the country, it has not happened in Connecticut, as data reveals a reduction in the density of high tech firms in the state’s major metropolitan areas during the past two decades.  (The U.S. average is 1.0.)

New Haven-Milford’s start-up density went from 1.1 in 1990, when it was one of nearly 70 metropolitan areas above the national average, to .5 in 2010, while the ICT sector start-up density dropped from above average at 1.2 in 1990 to .5 twenty years later.    The Norwich-New London metropolitan area reflects a drop from 1.1 to .8 in high tech start-up density and 1.1 to .9 in the ICT sector comparing 1990 and 2010.

The data indicate that the Hartford-West Hartford-East Hartford area reflected decreases from .9 high tech start-up densities in 1990 to .6 in 2010, and .8 ICT start-up density in 1990 to .7 two decades later. The Bridgeport-Stamford-Norwalk metropolitan region showed a drop from 1.4 to .9 in high tech start-up density over the 20 year period, moving from above to below the national average, and a parallel drop of 1.6 to 1.1 in ICT start-up density.

The website Engine, which collaboratedstart up density in the report, observed that “Each of the high density metro areas has one of three characteristics, and some have a combination of them all: 1) They are well-known tech hubs with highly skilled workforces, 2) They have a strong defense or aerospace presence, and 3) They are university cities.”

The report noted that “”high-tech startups are being founded across the country fueling local and national economic growth…and are a pervasive force in communities throughout the country.”  The Top 10 Metro Areas for High-Tech Startup Density (1990 and 2010 data):

  1. Boulder, Colo.  (High-tech 4.0 to 6.3; ICT 4.7 to 6.1)
  2. Fort Collins-Loveland, Colo. (High-tech 1.0 to 3.2; ICT 1.1 to 2.6)
  3. San Jose-Sunnyvale-Santa Clara, Calif.  (High-tech 3.0 to 2.6: ICT 4.4 to 2.9)
  4. Cambridge-Newton-Framingham, Mass. (High-tech 2.0 to 2.4; ICT 2.0 to 2.3)
  5. Seattle, Wash.
  6. Denver, Colo.
  7. San Francisco, Calif.
  8. Washington-Arlington-Alexandria, DC-Va.-Md.
  9. Colorado Springs, Colo.
  10. Cheyenne, Wyo.

"This report confirms the dynamism of the technology sector and its disproportionate contributions to the U.S. economy. It also underscores the need for policies that enable and support that dynamism," said Dane Stangler, director of Research and Policy at the Kauffman Foundation.

The report, released earlier this year, used data from the Business Dynamics Statistics (BDS) series, which is compiled by the U.S. Census Bureau and tracks the annual number of new businesses (startups and new locations) from 1976 to 2011.  Ten of the 14 high-tech industries can be classified as information and communications technology (ICT), while the remaining four are in the disparate fields of pharmaceuticals, aerospace, engineering services and scientific research and development.

In explaining the report, Engine noted that “While high-tech firms start small, they scale rapidly in the early years. So much so that young high-tech firms--those aged one to five years--contribute positively to net job creation overall. The opposite is true across the private sector as a whole, where the substantial job losses stemming from early-stage business failures - about half of all firms fail in their first five years - make young firms as a whole net job destroyers. Even when we remove the job destruction from all early-stage firm failures, surviving young high-tech businesses create jobs at a rate twice that of surviving companies in the private sector as a whole.”