Familiar Business Logos Coming to a Highway Near You, Promoting Tourism

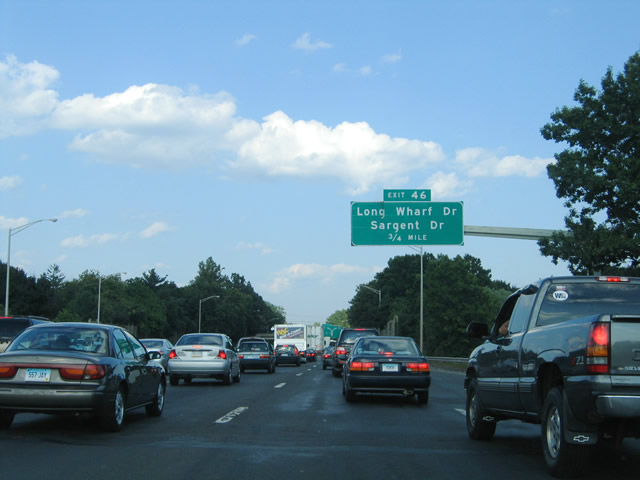
The logos of Taco Bell, Starbuck’s and Georgie’s Diner are among 10 business logos and 7 tourist attraction logos that will be appearing on a total of 27 state highway signs in Connecticut this year, under a state program just underway.  The highway signs, part of the state’s ongoing efforts to promote tourism, will appear on I-95, I-91, I-84, I-395 and Routes 8 and 9.

Administered by the state Department of Transportation, the 10 business logos that will be appearing on 13 signs across the state include A-1 Diner, Dunkin Donuts, Georgie’s Diner, Mobil, Starbucks, Comfort Inn, Taco Bell, Residence Inn, Guilford Suites, and Chili’s.

The seven tourist attraction logos that will appear on 14 roadway signs include the Essex Steam Train & Riverboat, The Griswold Inn, the Tanger Outlet Center, The Adventure Park at Storrs, Niantic Bay Boardwalk, Sailing Ship Argia Cruises, and Antique Center (at exit 8 on I-95).  Among the attractions, four attractions will be having signs posted for the first time, with each to have a sign in each roadway direction (northbologosund and southbound, or eastbound and westbound).

The largest number of logos appearing will belong to Taco Bell, with four roadway signs, on I-395 at exit 93, I-91 at exits 16 and 47E, and Route 9 at exit 19.

According to the DOT, the Specific Information (Logo) Signing Program is intended to provide the motoring public with information on essential travel services (gas, food, lodging, camping) that are available at qualified interchanges on expressways in Connecticut.

The program allows qualified businesses to apply and erect their business sign or logos on specific information (logo) signs. Businesses must meet minimum qualification criteria specified in the regulations governing the program. There are no exceptions or waivers. A non-refundable $2,000.00 application fee per business, per interchange must accompany the application.highway sign

Installation of business signs is permitted only after field review of business and sign feasibility is conducted by the Department and certain concurrences and permits are completed or obtained.

All costs for fabrication and installation of signing by a contractor is the responsibility of the initial business on an interchange approach. Subsequent businesses are required to reimburse the initial business a percentage of the initial business’s installation cost as indicated in the regulations. Subsequent businesses are also responsible for all costs for the installation of their business signs. Businesses must continue to meet minimum qualification criteria as long as the business sign is displayed or signing will be removed.

The Connecticut Tourist Attractions Sign Program is intended to create a predictable and recognizable system to help travelers locate places of interest that will make their experience in Connecticut more Adventure Storrs logoenjoyable. Participating businesses must indicate how many potential visitors they hope to attract at various periods during the year.  Those accepted Argiainto the signage program must annually update DOT on their visitor-traffic counts and provide related information.

In another project promoting Connecticut sites and attractions for highway travelers, I-95 will soon see signs posted by DOT promoting the University of Bridgeport, Housatonic College, Barnum Museum, Webster Bank Arena, Harbor Yard Ballpark, Shoreline Star Greyhound, Connecticut Audubon Center, Silver Sands State Park, Westfield Post Mall, PEZ Visitor Center, West Haven Beaches, University of New Haven Yale Bowl.  Three of the signs are new (Yale Bowl, Silver Sands and CT Audubon); the others are replacing existing signs.

Exodus: Connecticut Ranked #1 in People Moving From State

Connecticut residents are on the move.  Out.

The state led the nation with the highest percentage of outbound moves in 2013, according to Atlas Van Lines’ annual report of moves throughout the U.S. and Canada. Of 2,055 residents' moves during the year, 1,230 of them, or 60 percent, were out of state – the highest percentage in the nation.  That's compared to 825 moves from other states into Connecticut.new_atlas_logo

A year ago, Connecticut was #7 in the nation in the ratio people moving out-of-state, with 1,123 outbound and 834 inbound moves, in a survey by United Van Lines.  This year, Connecticut led the nation in outflow of residents in the Atlas Van Lines survey.

us moving mapDuring the past five years, inbound moves peaked in 2010 at 1,009 – with a just slightly higher  1,160 outbound moves.  Since then, the numbers have skewed increasingly out-of-state, Atlas reported.

The 2013 year was the state's highest outbound percentage and highest total number of outbound moves since 2009.  Connecticut has been an outbound state for six of the past ten years, including the past three consecutively, according to Atlas.  An “outbound” state is defined as one that has more than 55 percent of moves outbound.

The remainder of the New England states were "balanced" in 2013, with the exception of New Hampshire, which was considered an inbound state in 2013. The data indicates that progressively fewer people were moving into Connecticut in the last three years, a pattern not consistent throughout New England.  None of the other New England states were outbound states in 2013.  In the previous year, Maine joined Connecticut as an outbound state in the United Van Lines survey.

States that saw the greatest percentage of inbound movers: North Dakota, North Carolina, and Texas.  States with the highest outbound move percentage after Connecticut were New York and Indiana, both at 59 percent.  Only 12 states were net outbound states:  Connecticut, New York, Indiana, Wyoming, Delaware, Nebraska, Minnesota, Illinois, Indiana, Ohio, Pennsylvania, and New Jersey.Connecticut

The Greenwich Time reported that the branch manager of Danbury's Certified Van Service of Connecticut say, his truckers – part of the United Van Lines company - relocated about 100 families from the Hartford area to Charlotte, N.C., and from Fairfield County to Atlanta. For Kevin Kaster, president and owner of Kaster Moving in Stamford, the study confirms one trend he's recently experienced.  "Texas has been a hotspot the last two years, no question," he said. "An inordinate amount of people from around here are going to Texas."  Brielle Sollinger, aoutboundssistant marketing manager at Fallon Moving and Storage in Windsor, agreed.   "Texas is big. We also do lots of Virginia, North Carolina and South Carolina," she said in a phone interview Friday afternoon.

Atlas reported that across the nation, most states were balanced evenly between inbound and outbound moves. The company also reported that the number of total moves increased during the year, something it said could be an indicator of an improving economy.  The data covered the period from January 1 through December 31, 2013.

New Haven Is Among Most Walkable Cities in America, Ranks #8 Nationwide

New Haven is one of America’s most walkable cities, with 11.2 percent of commuters walking to work, the 8th highest percentage in the nation, among cities with populations of at least 100,000.  The top 10 list of Most Walkable Cities, published by GOVERNING magazine, notes that many of top communities are in the Northeast, and that communities across the country are stepping up efforts to enhance alternative ways of commuting from home to work. New_Haven_downtown_map
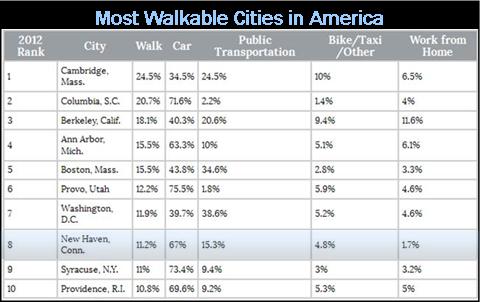
The top cities were Cambridge, MA (24.5%), Columbia , SC (20.7%), Berkeley, CA (18.1%), Ann Arbor, MI (15.5%), Boston, MA (15.5%), Provo, UT (12.2%), Washington, DC (11.9%), New Haven, CT (11.2%), Syracuse, NY (11%) and Providence, RI (10.8%).OLYMPUS DIGITAL CAMERA

Overall, 67 percent of New Haven commuters use their car, 11.2 percent walk, 4.8 percent bike or use other modes of transportation, and 1.7 percent work from home., according to the data developed from the U.S. Census Bureau's American Communities Survey, which included 300 metropolitan areas.

Nationally, only 2.8 percent of workers primarily commuted by walking last year, a figure that remains mostly unchanged from recent annual estimates, GOVERNING reported.

Among the New Haven walkers, 36 percent are age 16-24, 52 percent are age 25-44, 9 percent are age 45-64 and 2 percent are age 65 or older.  The median age of walk commuters is 27.8, according to the date.  In categorizing individuals, a person’s longest distance traveled is used, so those walking tp transit stations are designated as public transportation commuters, even though a portion of their daily commute involves walking.

Among Connecticut’s most populous cities, in Bridgeport 4.3 percent of commuters walk to work; in Stamford the figure is 4.7 percent, in  Hartford 7.9 percent, and in Waterbury 2.6 percent.

walkable chart

Percentage of Drivers Age 85 and Older: Connecticut Leads USA

Connecticut has more than double the percentage of licensed drivers age 85 and older than any other state in the nation, according to data compiled by Bloomberg.

In the Land of Steady Habits, 5.1 percent of all drivers – a total of 152,233 people – were age 85 or older, ranking Connecticut at the top of the state-by-state ranking.  The second place state, Maine, had 2.34 percent of its licensed drivers in that demographic.

The Insurance Institutolder drivers
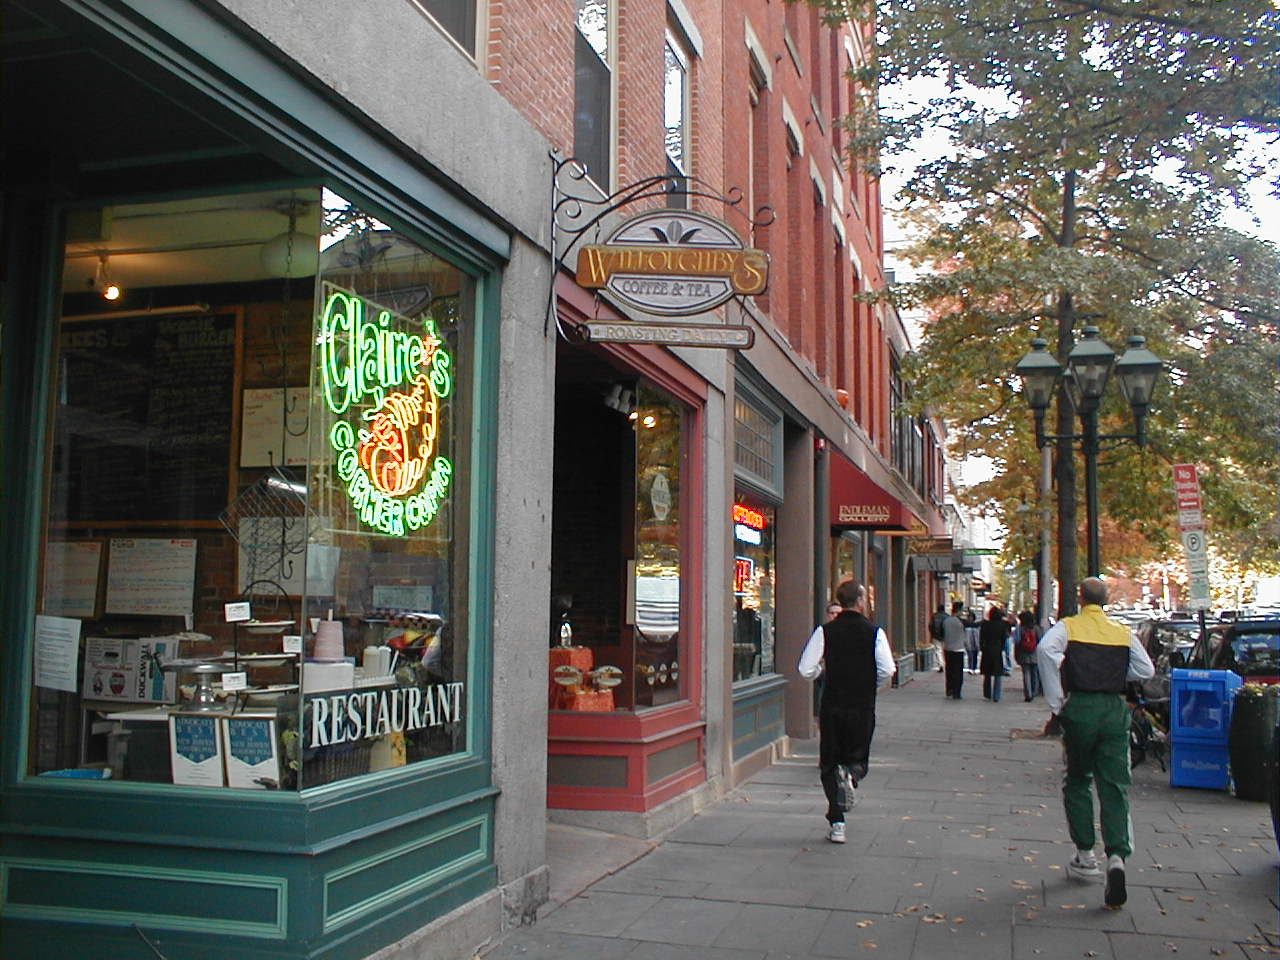
e for Highway Safety reports that 29 states and the District of Columbia have additional license renewal procedures for older drivers, often age 65 or 70 and older.  In Connecticut, people 65 and older may choose a 2-year or 6-year renewal cycle. A personal appearance at renewal generally is required. Upon a showing of hardship, people 65 and older may renew by mail. There are no additional requirements for older drivers, according to the Insurance Institute.

Bloomberg ranked the U.S. states and the District of Columbia on the percentage of licensed drivers ages 85 and older, using data from the Federal Highway Administration.  (The data was for 2011, the most recent year available.)

The Age 85+ Rankings (percent of licensed drivers)elderly-driver

  1.  Connecticut        5.10%
  2. Maine                   2.34%
  3.  Alabama              2.23%
  4. Vermont              2.22%
  5.  Minnesota          2.11%
  6. New York            2.09%
  7. Nebraska             2.02%
  8.   South Dakota     1.99%
  9.  Florida                  1.98%
  10. Pennsylvania     1.98%

Rhode Island ranked #11, New Jersey was #15, Massachusetts was #17 and New Hampshire was #28 among states in our region.

Although they only account for about 9 percent of the population, National Highway Traffic Safety Administration statistics show senior drivers account for 14 percent of all traffic fatalities and 17 percent of all pedestrian fatalities, ABC News reported last year.

The network cited a report by Carnegie Mellon University in Pittsburgh and the AAA Foundation for Traffic Safety that found the rate of deaths involving drivers 75 to 84 is about three per million miles driven – on par with teen drivers. Once they pass age 85, vehicular fatality rates jump to nearly four times that of teens.  The Insurance Institute reports that the increased fatal crash risk among older drivers is largely due to their increased susceptibility to injury, particularly chest injuries, and medical complications, rather than an increased tendency to get into crashes.

An Institute study of a Florida vision test requirement for drivers 80 and older found that 80 percent of those eligible to renew their licenses attempted to do so, and 7 percent of them were denied renewal because they failed the vision test. Of those who did not seek renewal, about half said they thought they would fail the vision test.

Two-Thirds of Drivers Use Cell Phones While Driving Despite Dangers, Survey Says

It turns out that the problems is much greater than just teens.  Texting while driving – like texting – is cutting across the population, presenting dangers that are well-documented and increasingly ignored.  And it’s not only texting – it is the use of phones while driving as well that is causing concerns among safety experts.

New research from the AAA FoundOLYMPUS DIGITAL CAMERA
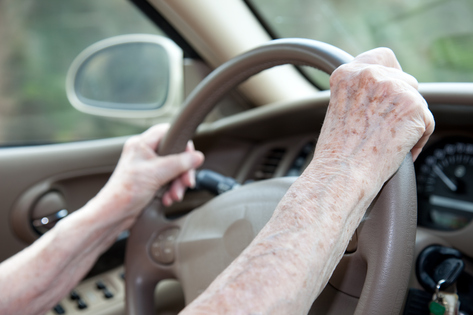
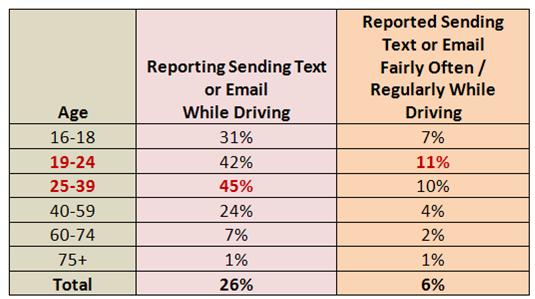
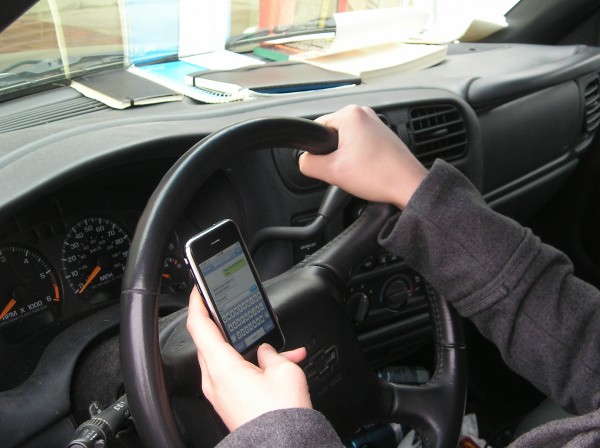
ation for Traffic Safety indicates that high school-aged teens report using their phones or texting while driving substantially less often than adults do.  The AAA survey found that adult drivers ages 25-39 were the most likely to admit engaging in these risky behaviors behind the wheel.

Though the practice is hazardous at any age, two out of three drivers reported using a cell phone while driving within the past month. Forty-three percent of adults ages 25-39 reported doing so fairly often or regularly while driving, compared to only 20 percent of teens.  Motorists age 60 and up were the least likely to report using a phone.

“Using your phone while driving may seem safe, but it roughly quadruples your risk of being in a crash according to previous research,” said Stephen Rourke, manager of driving school administration for AAA. “None of us is immune from the dangers of distracted driving. The best advice is to hang up and drive.”AAA age

More than one-in-four motorists reported sending a text or email while driving within the past month. Adults ages 25-39 reported texting and driving most frequently, while those age 60 and up reported doing it the least.

According to the National Highway Traffic Safety Administration, one out of every ten fatal crashes involves distraction, resulting in more than 3,000 deaths per year, although experts agree the numbers are likely underestimated.

Previous research shows that hands-free cell phones offer no significant safety benefits over handheld phones – hands-free is not risk-free.  Earlier this year, Connecticut by the Numbers reported on a proposal in Connecticut to ban the useAAA text chart 
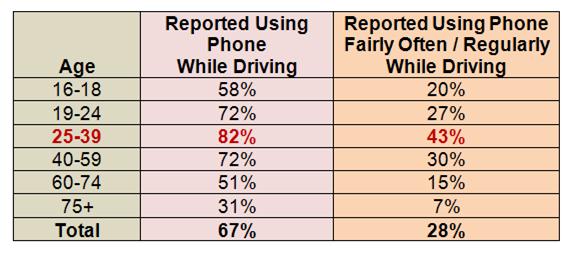
of electronic devices in vehicles.

The AAA Foundation for Traffic Safety collected the data as part of the 2013 Traffic Safety Culture Index. The data are from a sample of 2,325 licensed drivers, ages 16 and older, who reported driving in the past 30 days.

Rising Star No More, Visitors Now Urged to DASH

Hartford’s downtown circulating bus – developed as an easily accessible means of moving tourists and convention goers around the city – was re-launched this fall with a new name, distinctive new coat of paint and renewed enthusiasm.

Previously operating as the Star Shuttle since September 2005, nearly 728,700 passengers have used the specially designated bus service, which connects the Connecticut Convention Center, the Riverfront, the CT Science Center, the Arts and Entertainment District, various restaurants, and downtown hotels.

Now, it has received an all-orange makeover, along with the new name – DASH.

The change follows the change in Hartford's tourism campaign branding from "New England's Rising Star" to "Hartford Has It" and continues as  a collaboratiodash
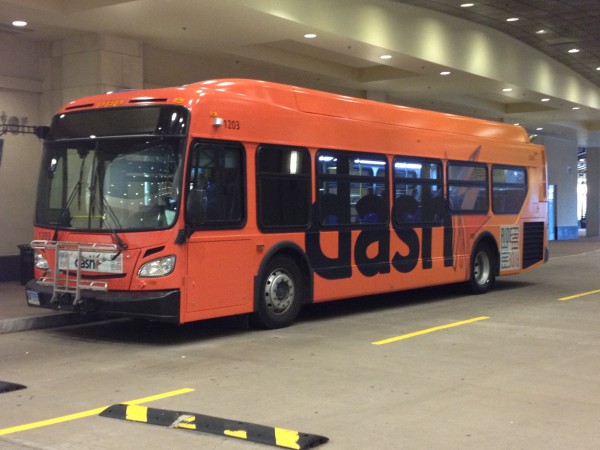
n among CT TRANSIT, CT DOT, the City of Hartford, the Capitol Region Development Authority, the Hartford Business Improvement District, the Hartford Metro Alliance, and the Connecticut Convention & Sports Bureau.

A year ago, the Hartford Business Improvement District tapped the collective creativity of capitol region residents to help re-name the free downtown circulator.  Local resident David Ceder suggested “dash”. Ceder explained "I am excidashart_webted the time has come to showcase the rebranding and new shuttle name! I chose "dash" not only because of the acronym (Downtown Area SHuttle) but also because it's an action word --"dash," to me, is exciting, inviting, and invokes you to hop on and discover Downtown."

The bright orange DASH bus has been accompanied by updated signs downtown and an interactive map to help passengers know where to go to get on the free shuttle. Regular DASH service operates every weekday from 7:00 a.m. to 7:00 p.m., departing every 15 minutes from the Connecticut Convention Center.

During major downtown events, enhancements may include later evening service on weekdays, as well as service on Saturdays and Sundays. The specific services planned for each major event are posted on the CT TRANSIT website. The dash Shuttle does not operate on weekends when there is no downtown event scheduled.  The free shuttle also offers convenient connections to both the Bradley Flyer bus and to regular local CT TRANSIT bus service.

An out-of-town visitor to a convention earlier this year – before the name change -  praised the service. "My daughter and I ...have been using the Shuttle extensively to navigate the conference sites. I cannot say enough good things about ALL of the bus drivers. Thanks for making our trip so much fun."

Should you be  wondering, two buses have received the DASH makeover, adash map
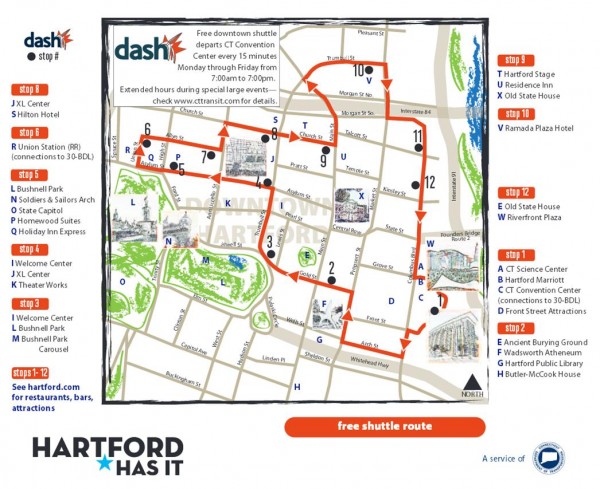
nd the vehicles alternate in providing the service.  The DASH shuttle is a service of the CT Department of Transportation and operated by CT TRANSIT. Information on the route and extended service hours can be found at www.cttransit.com.

Connecticut Ranks #13 in Workers Employed Here Who Live Elsewhere

The percentage of Connecticut workers who live outside the Constitution State is among the highest in the country, ranking 13th overall, at 6.4 percent.  Data from the American Community Survey of the U.S. Census Bureau indicates that Delaware has the largest percentage of workers who reside outside the state, at 14.8 percent. (The District of Columbia exceeds all the states, at 72.4map-usa percent.)

In examining the top commuting flows from state of residence to workplace state, Connecticut ranks at #14, with 66,652 people traveling from their homes in Connecticut to work in New York.  The leading residence-to-workplace combination is New Jersey to New York, with 396,520 workers commuting from the Garden State to the Empire State for their jobs.  The other top pairs are Maryland to D.C., Virginia to D.C., New York to New Jersey, and Pennsylvania to New Jersey.

The Survey’s analysis points out that “information about commuting activity between two specific geographic areas helps define commuting patterns and provides a gauge of economic interconnectedness.”

The top 15 states, and the percentage of their workers who live outside the state’s borders, are:

  1. D.C.                        72.4%
  2. Delaware             14.8%
  3. Rhode Island      12.8%
  4. North Dakota     11.6%
  5. New Hampshire 10.8%
  6. West Virginia     10.0%
  7. Maryland             9.1%
  8. Kansas                  8.4%
  9. Kentucky             7.8%
  10. Missouri               7.4%
  11. Vermont              7.1%
  12. Virginia                 6.8%
  13. Connecticut       6.4%morning traffic
  14. New York            6.4%
  15. Massachusetts  6.3%

 The statistics in the survey, which was issued earlier this year, reflects 2011 data.  The report also noted that among U.S. workers who did not work at home, 8.1 percent had commutes of 60 minutes or longer.  New York had the highest rage of “long commutes” at 16.2 percent, followed by Maryland and New Jersey at 14.8 percent and 14.6, respectively.  In Connecticut, 6.4 percent of workers working in the state have a commute of 60 minutes or longer.

The American Community Survey (ACS) is a nationwide survey designed to provide communities with reliable and timely demographic, social, economic, and housing data for the nation, states, congressional districts, counties, places, and other localities every year. It had a 2011 sample size of about 3.3 million.

Veteran Astronaut from Connecticut Prepares for Next Launch, Followers Turn to Twitter

The National Aeronautics and Space Administration (NASA) will be among the agencies contributing crew members on upcoming missions to the International Space Station this fall, including a veteran astronaut who grew up in Waterbury.

Expedition 38, scheduled for launch in November, will bring three new crew members to the space station aboard the Soyuz TMA-11M to be launched by Russia.  They include flight engineers Richard Mastracchio of the United States, Koichi Wakata of Japan, and Mikhail Tyurin of Russia.  They are scheduled to reRichard Mastracchiomain on the space station until May 2014.

Graduated from Crosby High School in Waterbury in 1978, Mastracchio received a bachelor of science degree in electrical engineering/computer science from the University of Connecticut in 1982, a master of science of degree in electrical engineering from Rensselaer Polytechnic Institute in 1987, and a master of science degree in physical science from the University of Houston-Clear Lake in 1991.  He worked for Hamilton Standard in Connecticut as an engineer in the system design group from 1982 until 1987.  During that time, he participated in the development of high performance, strapped-down inertial measurement units and flight control computers.  He was selected to serve as an astronaut in 1996.

Now a veteran of three space flights, Flight Engineer Mastracchio and his crew members will participate in a number of training activities to prepare them for their jobs on the upcoming mission, include a wide spectrum of disciplines, from science research and on-orbit medical operations to spacewalk procedures and robotics. His training will also include extensive travel to other station partner countries, such as Japan and Russia, to practice and learn the specialized hardware and equipment provided by these nations.

The Connecticut native will share with the public ‘behind the scenes’ of what it’s like to train like an astronaut for a mission aboard the International Space Station via Twiin spacetter. Follow @AstroRM to share his training experience during his finals months of mission preparations. Followers will learn about human space exploration, astronaut training and the research and technology aboard the International Space Station, according to NASA.

Mastracchio is one of two Connecticut natives currently among the active astronaut corp.  Daniel Burbank, who grew up in Tolland, concluded a 163-day mission on the International Space Station last year, returning to Earth in April 2012.  He is a graduate of Tolland High School and was selected to be an astronaut in 1996.  He served as Mission Specialist on two space shuttle missions and as Flight Engineer on Expedition 29 and Commander of Expedition 30 at the International Space Station.  He has logged 7 hours and 11 minutes of spacewalk time.

Since joining NASA, Mastracchio has worked technical issues for the Astronaut Office Computer Support Branch, Space Station Operations, the EVA Branch and as a CAPCOM.  He served as the display design lead for the Space Shuttle cockpit avionics upgrades in 2003.  From 2004 until 2009, he has worked various Constellation and Orion tasks including Cockpit design lead, and Constellation deputy branch chief.  Mastracchio flew as a mission specialist on STS-106, STS-118, and STS-131, and has logged nearly 40 days in space, including 6 EVAs totaling 38 hours and 30 minutes.

Since Expedition 1, which launched Oct. 31, 2000, and docked Nov. 2, the International Space Station has been visited by 204 individuals.  It is not only an orbiting laboratory, but also a space port for a variety of international spacecraft. As of June 2013, there have been 89 Russian launches, 37 Space Shuttle launches among the flights.

A total of 168 spacewalksExpedition 38 have been conducted in support of space station assembly totaling more than 1,061 hours, or more than 44 days.  The space station, including its large solar arrays, spans the area of a U.S. football field, including the end zones, and weighs 924,739 pounds. The complex now has more livable room than a conventional five-bedroom house, and has two bathrooms, a gymnasium and a 360-degree bay window.

Tyurin, a Russian living just outside of Moscow, most recently was the Commander of Soyuz-13 (TMA-9) / Expedition 14, launching on September 18, 2006 from Baikonour, and docking with the International Space Station on September 20, 2006. He served as Flight Engineer during a six-month tour of duty aboard the space station, his second tour on the International Space Station. Tyurin performed five spacewalks accumulating 25 hours and 32 minutes of EVA time and a total of 215 days in space. The mission concluded on April 21, 2007 with a landing in the steppes of Kazakhstan.  In completing his second space mission, Tyurin has accumulated a total of 340 days in space including 25 hours and 32 minutes of EVA time in 5 spacewalks.

From March to July, 2009, Dr. Wakata flew as the first resident ISS crew member from Japan and served as a Flight Engineer and the JAXA Science Officer on the crews of Expeditions 18, 19 and 20 as well as a Mission Specialist on STS-119 and STS-127 (2J/A). His duties during the four-and-half month flight included the installation of the S6 Truss, the final assembly of Kibo, a variety of experiment operation in science, engineering, art, and education, as well as ISS systems operations and maintenance. He became the first Japanese astronaut to fly aboard Soyuz TMA spacecraft on orbit. A veteran of three space flights, Dr. Wakata has logged a total of 159 days, 10 hours, 46 minutes and 5 seconds in space.  Early next year, he is slated to be the first Japanese astronaut to command the ISS as part of Expedition 39.

CT Residents Are Driving Less, Reflecting National Trend

Connecticut residents have cut their per-person driving miles by 3.45 percent since 2005, while the nation’s long term driving boom appears to have ended, according to a report by the ConnPIRG Education Fund. The decline in driving is a national trend, with 46 states including Connecticut having reduced per-person driving since the middle of the last decade.

The 31-page report, “Moving Off the Road: A State-by-State Analysis of the National Decline in Driving,” is based on the most current available government data. The average number of miles driven by Americans is in its eight consecutive year of decline, led Moving Off the Road Thumbnailby declines among Millennials. Connecticut has had the slowest decline in driving in New England, but has the second lowest vehicle miles traveled per person in region, behind Rhode Island. The national trend in driving peaked in 2005.

“It’s time for policy makers to recognize that the driving boom is over. We need to reconsider expensive highway expansions and focus on alternatives such as public transportation and biking—which people increasingly use to get around,” said Abe Scarr, Director of the ConnPIRG Education Fund.

“The Millennial generation is leading the decrease in driving and will be using and paying for our transportation system for years to come.  It is critical that Connecticut plans a system that reflects how people are getting around and want to get around,” said Scarr.  The report noted that “the evidence suggests that the nation’s per-capita decline in driving cannot be dismissed as a temporary side effect of the recession.”

Earlier this year, Governor Malloy and Department of Transportation Commissioner James Redeker launched a multi-year strategic planning process, Transform CT, which aims to “improve economic growth and competitiveness, build sustainability, and provide a blueprint for a world-class transportation system.”  TransformCT_published_Cycle_Small

Transform CT has established an interactive website to gather public input which has collected nearly 300 comments, suggestions or ideas to date, and will be updated with topics and polls regularly as the strategic plan is developed over 18-20 months. In addition, a series of events will be held throughout the fall to engage the public on the future of transportation in Connecticut.

 “Connecticut’s investment in critical transit projects like CTfastrak and the New Haven-Springfield commuter rail line show that transportation decisions better reflect changing travel preferences of residents,” said Ryan Lynch, associate director for the Tri-State Transportation Campaign, a non-profit policy organization.

The Tri-State Transportation Camcars on hwaypaign, a 501(c)(3) non-profit organization dedicated to reducing car dependency in New York, New Jersey, and Connecticut, celebrates its 20th anniversary with a fundraising benefit in New York City on November 7.  The Campaign was formed in the early nineties as a response to the mounting economic and environmental costs of automobile and truck dependence and promising reforms in federal transportation policy. Among the organization’s board members is Norman Garrick, Director of the Center for Transportation and Urban Planning at the University of Connecticut.

North Dakota, Nevada, Louisiana and Alabama are the only states in the nation where driving miles per capita in 2011 were above their 2004 or 2005 peaks, the ConnPIRG report found.  Meanwhile, since 2005, double-digit percent reductions occurred in a diverse group of states: Alaska, Delaware, Oregon, Georgia, Wyoming, South Carolina, the District of Columbia, Pennsylvania, Indiana and Florida.

The states with the biggest reductions in driving miles generally were not the states hit hardest by the economic downturn, according to the ConnPIRG report. The majority—almost three-quarters—of the states where per-person driving miles declined more quickly than the national average actually saw smaller increases in unemployment compared to the rest of the nation, according to the report.

Mathematics and Transportation of Cities Draws New Research Analysis

UConn researchers have collaborated to develop a new index that will measure the sustainability of complex urban transportation systems.  The index will allow policymakers, scientists and the public to understand not just how congested cities’ transportation systems are, but the economic, social, and environmental impacts of the system as a whole.

A team of researchers in UConn’s departments of geography and civil and environmental engineering developed The Transportation Index for Sustainable Places, or TISP.  The new approach is part of the July themed issue of the journal Research in Transportation Business & Management, edited by  Carol Atkinson-Palombo, assistant professor of geography, Norman Garrick, associate professor of civil and environmental engineering, and Wesley Marshall, a former graduate student of Garrick’s who is now a faculty member at the University of Colorado, Denver. TISP

“Policy in developed countries and in the U.S. in particular has tended to focus on relieving congestion and has largely ignored social and environmental impacts associated with expanding freeways,” says Carol Atkinson-Palombo. “This index takes a more holistic approach, which gives a comprehensive sense of the effects of the system.”

The TISP takes into account environmental factors like land use efficiency, minimizing natural resource consumption, and reducing greenhouse gas emissions. Social factors are also measured, such as meeting access needs, incorporating public health and safety and maintaining a community in areas served by transportation. These factors combine with economic measures, such as affordability, self-sufficiency, and efficiency, to create a comprehensive metric, UConn Today reported.

Garrick says that many people only think about transportation in terms of traffic. These so-called congestion indices, he says, are misleading because they are not necessarily about making the city better, but simply moving cars more efficiently.

“In many cities, only 40 percenNewHavenRoute34aftert of the people commuting are in cars,” he points out. “The majority of the people aren’t affected by the congestion index, yet this is the only measure of the impact of the transportation system that is ever discussed in the media.”

Mathematics of Cities

In another initiative aimed at taking a closer look at the function of cities, the view that cities are dissimilar and disordered systems has begun to change.  Patterns have emerged within the supposed chaos, and researchers in economics, physics, complexity theory and statistical mechanics have concluded that cities, mathematically speaking, might actually be basically the same. Though strikingly different in culture and layout, cities like London and Beijing, for example, share many properties with regard to infrastructure, social interactions and productivity.

The new conclusions – decades in the making - are part of a growing field dedicated to the science of cities, Science News, the magazine of the Society for Science & The Public, reports in its most recent edition.   Roughly 75 percent of people in the developed world now live in urban environments. While much of the research is in its early days, eventually it may serve as a powerful, widely used tool for urban planners and policymakers, the publication reports.

Physicist and complex systems scientist Luís Bettencourt of the Santa Fe Institute in New Mexico has developed a theory which captures the interplay between a city’s population, its area, the properties of its infrastructure and its social connectivity. His theory suggests that city planning should not involve grand, top-down projects, but perhaps well-considered smaller ones.

The mathematical work is rooted in and reinforces the view “that cities grow from the bottom up,” says Michael Batty, who trained as an architect, planner and geographer and went on to found the Centre for Advanced Spatial Analysis at University College London. “The diversity of life [in cities] offers greater opportunities for mixing ideas.”

The emerging mathematical theory of cities stands on four basic assumptions:

  1. Cities mix varied people together, allowing them to reach each other.
  2. Cities are networks that grow gradually and incrementally, connecting people.
  3. Human effort isn’t limitless and stays the same regardless of urban size.
  4.   Measures of the socioeconomic output of a city — things like the number of patents awarded or crime rate — are proportional to the number of social interactions.

 “In a nutshell, the city is the best way of creating a vast, open-ended social network that minimizes the cost of moving things in and around an environment,” Bettencourt says. “When people brush up against each other, that’s when the magic of the city happens — the social reactor begins to work.”

Cities Reshape Transportation Mix

At UConn, when the research team used the TISP index to look at transportation in the U.S., they found some not-so-surprising results: areas with higher rates of driving rather than public transportation have greater carbon emissions, and having more cars and highways increases traffic fatality risk.  But despite the prevailing perception, says Garceau, the researchers found that decityveloping varied transportation systems that include a combination of roads and public transportation are more cost-effective than simply building highways.

Many cities have already begun to adjust their transportation planning. Some have begun dismantling freeways that run through their downtowns to reconstruct a truly urban atmosphere. New Haven is in the midst of doing precisely that in Connecticut, eliminating the Route 34 connector and replacing it with an urban boulevard that will reconnect city neighborhoods cut off for decades.

Others cities are moving forward with light rail and bus rapid transit systems (such as CTfastrak between Hartford and New Britain, now under construction) and encouraging walking and bicycle use by building compact, mixed-use communities that focus on pedestrians rather than cars.  Garrick points to Cambridge, Mass., Portland, Ore., and New York City as U.S. cities that have taken strides toward sustainable transportation. On a smaller scale, he cites Storrs, the home of UConn’s main campus, for developing a walkable town center from scratch, and planning for greater bus access as the newly-minted downtown area unfolds.