College Coaches Are Highest Paid Public Employees in 40 of 50 States, Including CT

When UConn announced the hiring of Bob Diaco as new head football coach earlier this month few flinched at the compensation – a reported five-year $8 million contract.  Diaco, who served on the Notre Dame coaching staff as the defensive coordinator for the past four years and the assistant head coach for the past two, was the 2012 winner of the Frank Broyles Award, given to the top assistant college football coach in the country and was the first Irish assistant to receive the prestigious award. He was a semifinalist for the award in 2011.

Earlier this year, the Yankee Institute for Public Policycoaches salaries compiled a list of the highest paid state employees, and three UConn coaches led the list:
  • 1. Calhoun, James A., Men's Basketball Head Coach, UConn $2,865,769
  • 2. Auriemma, Geno, Women's Basketball Head Coach, UConn $1,829,052
  • 3. Pasqualoni, Paul L., Football Head Coach, UConn $1,613,920  (dismissed as coach earlier this fall)

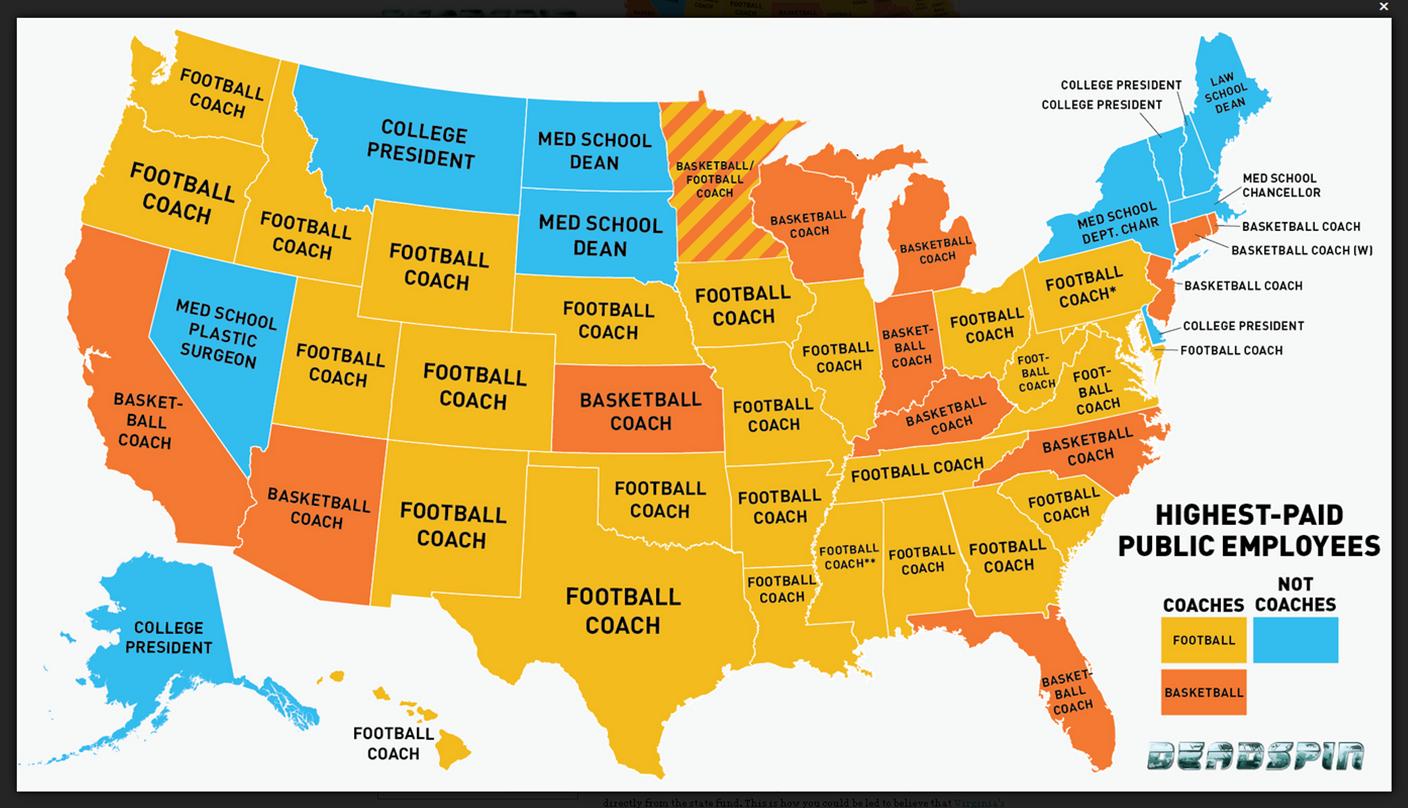
As it turns out, that is not unusual.  According to data compiled by the website Deadspin, the ranks of the highest-paid active public employees in states across the country include 27 football coaches, 13 basketball coaches, one hockey coach, and  10 state employees with responsibilities outside of athletics.  That’s 80 percent of the states with a public employee salary roster led by a coach.

Perhaps surprisingly, the states of New York, Massachusetts, Vermont, New Hampshire and Maine are among those where a college president, law school dean medical school dean or department chair top the state employee salary list.  In Rhode Island, it is the men’s basketball coach, and in Connecticut, with the retirement of Jim Calhoun, the leader is now women’s basketball coach Geno Auriemma.

Last December, UConn and head men's basketball coach Kevin Ollie, a 1995 UConn graduate,  announced a new agreement to run from January 1, 2013 through April 15, 2018.  Under the coaching contract, Ollie receives a base salary of $400,000 per calendar year and for 2013 he will receive $800,000 for institutional speaking engagements and media related appearances for a total of $1,200,000, according to the University's announcement. The payment for institutional speaking engagements will increase by $50,000 each year. Ollie's total compensation for each year of the agreement will be: 2013-$1,200,000; 2014-$1,250,000; 2015-$1,300,000; 2016-$1,325,000; 2017-$1,340,000; 2018-$502,500 (annualized from Jan. 1-April 15).

The website reports that “looking at data from 2011-2012, athletic departments at 99 major schools lost an average of $5 million once you take out revenue generated from "student fees" and "university subsidies.”

Rounding out the top 10 list in Connecticut, as of 2012:

  • 3. Onyiuke, Hilary Chief, Division of Neurosurgery UConn Health Center $1,030,732
  • 4. Nulsen, John Director, Center for Advanced Reproductive Services, UConn Health Center $917,373
  • 5. Makkar, Hanspaul Chief, Division of Pediatric Dermatology, UConn Health Center $916,600
  • 6. Whalen, James Vice Chair, Dermatology UConn Health Center $884,602
  • 7. Laurencin, Cato CEO, Connecticut Institute for Clinical and Translational Science, UConn Health Center, $701,576
  • 8. Herbst, Susan ,President, UConn $612,500
  • 9. McFadden, David, Chief, Department of Surgery, UConn Health Center $576,923
  • 10. Manuel, Warde Athletic Director UConn $551,305
 

New Haven Is Among Most Walkable Cities in America, Ranks #8 Nationwide

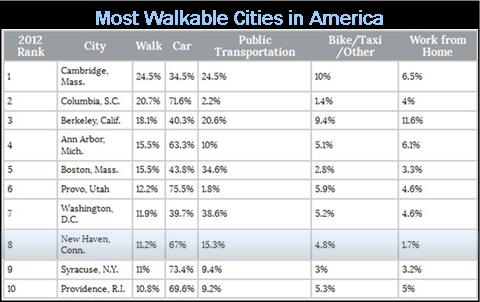
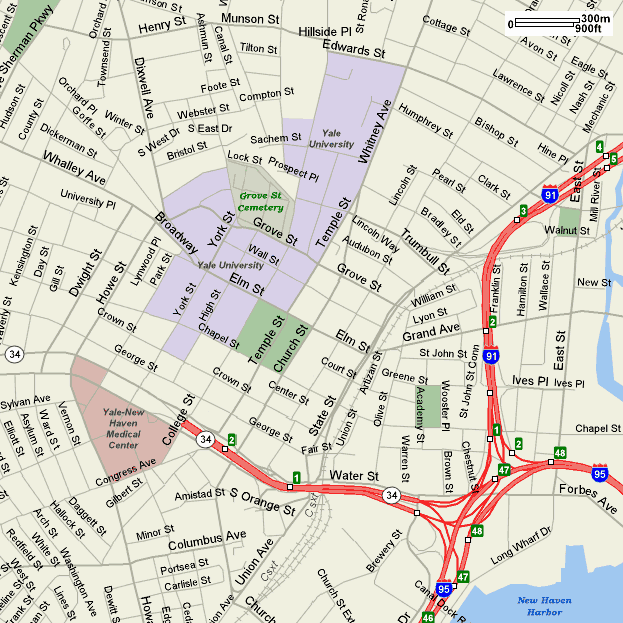
New Haven is one of America’s most walkable cities, with 11.2 percent of commuters walking to work, the 8th highest percentage in the nation, among cities with populations of at least 100,000.  The top 10 list of Most Walkable Cities, published by GOVERNING magazine, notes that many of top communities are in the Northeast, and that communities across the country are stepping up efforts to enhance alternative ways of commuting from home to work. New_Haven_downtown_mapThe top cities were Cambridge, MA (24.5%), Columbia , SC (20.7%), Berkeley, CA (18.1%), Ann Arbor, MI (15.5%), Boston, MA (15.5%), Provo, UT (12.2%), Washington, DC (11.9%), New Haven, CT (11.2%), Syracuse, NY (11%) and Providence, RI (10.8%).OLYMPUS DIGITAL CAMERA

Overall, 67 percent of New Haven commuters use their car, 11.2 percent walk, 4.8 percent bike or use other modes of transportation, and 1.7 percent work from home., according to the data developed from the U.S. Census Bureau's American Communities Survey, which included 300 metropolitan areas.

Nationally, only 2.8 percent of workers primarily commuted by walking last year, a figure that remains mostly unchanged from recent annual estimates, GOVERNING reported.

Among the New Haven walkers, 36 percent are age 16-24, 52 percent are age 25-44, 9 percent are age 45-64 and 2 percent are age 65 or older.  The median age of walk commuters is 27.8, according to the date.  In categorizing individuals, a person’s longest distance traveled is used, so those walking tp transit stations are designated as public transportation commuters, even though a portion of their daily commute involves walking.

Among Connecticut’s most populous cities, in Bridgeport 4.3 percent of commuters walk to work; in Stamford the figure is 4.7 percent, in  Hartford 7.9 percent, and in Waterbury 2.6 percent.

walkable chart

Percentage of Drivers Age 85 and Older: Connecticut Leads USA

Connecticut has more than double the percentage of licensed drivers age 85 and older than any other state in the nation, according to data compiled by Bloomberg.

In the Land of Steady Habits, 5.1 percent of all drivers – a total of 152,233 people – were age 85 or older, ranking Connecticut at the top of the state-by-state ranking.  The second place state, Maine, had 2.34 percent of its licensed drivers in that demographic.

The Insurance Institutolder driverse for Highway Safety reports that 29 states and the District of Columbia have additional license renewal procedures for older drivers, often age 65 or 70 and older.  In Connecticut, people 65 and older may choose a 2-year or 6-year renewal cycle. A personal appearance at renewal generally is required. Upon a showing of hardship, people 65 and older may renew by mail. There are no additional requirements for older drivers, according to the Insurance Institute.

Bloomberg ranked the U.S. states and the District of Columbia on the percentage of licensed drivers ages 85 and older, using data from the Federal Highway Administration.  (The data was for 2011, the most recent year available.)

The Age 85+ Rankings (percent of licensed drivers)elderly-driver

  1.  Connecticut        5.10%
  2. Maine                   2.34%
  3.  Alabama              2.23%
  4. Vermont              2.22%
  5.  Minnesota          2.11%
  6. New York            2.09%
  7. Nebraska             2.02%
  8.   South Dakota     1.99%
  9.  Florida                  1.98%
  10. Pennsylvania     1.98%

Rhode Island ranked #11, New Jersey was #15, Massachusetts was #17 and New Hampshire was #28 among states in our region.

Although they only account for about 9 percent of the population, National Highway Traffic Safety Administration statistics show senior drivers account for 14 percent of all traffic fatalities and 17 percent of all pedestrian fatalities, ABC News reported last year.

The network cited a report by Carnegie Mellon University in Pittsburgh and the AAA Foundation for Traffic Safety that found the rate of deaths involving drivers 75 to 84 is about three per million miles driven – on par with teen drivers. Once they pass age 85, vehicular fatality rates jump to nearly four times that of teens.  The Insurance Institute reports that the increased fatal crash risk among older drivers is largely due to their increased susceptibility to injury, particularly chest injuries, and medical complications, rather than an increased tendency to get into crashes.

An Institute study of a Florida vision test requirement for drivers 80 and older found that 80 percent of those eligible to renew their licenses attempted to do so, and 7 percent of them were denied renewal because they failed the vision test. Of those who did not seek renewal, about half said they thought they would fail the vision test.

CT State Employees: More Women Than Men, Mostly Middle-Aged

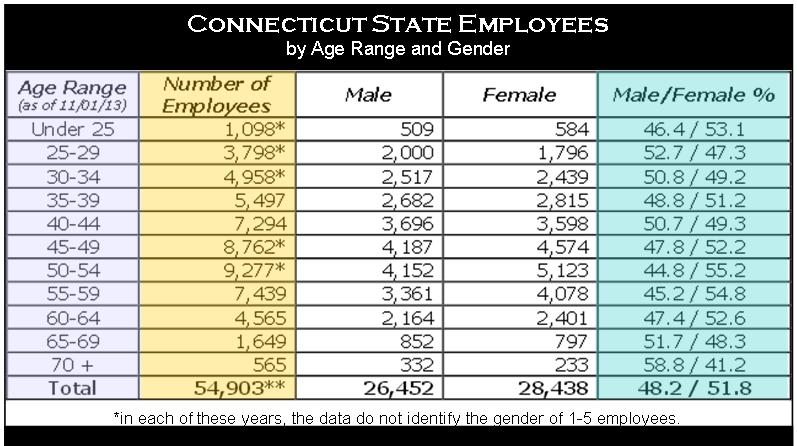
Of Connecticut’s 54,903 state employees in 2013, most were female, and between 40 and 60 years old, according to new demographic data released by the Office of Legislative Research based on information provided by the Office of State Comptroller’s CORE-CT data management system.

The breakdown comes just after indications that sCT state employeestate governments across the country are growing at a considerably slower rate than the private sector – which is true in Connecticut as well, where public sector jobs have been shed in recent years.

According to the state employee data:

  • Female state employees outnumber male state employees by 1,986
  • There are 9,277 employees aged 50 through 54 – the largest age group of state employees. 55% of them are female
  • 60%of state employees are between 40 and 60 years old.
  • 53% of the employees between 40 and 60 are female
  • 50.2% of state employees under 40 are male
  • 4% of state employees are age 65 or older
  • 58.8% of state employees age 70 and over are male.

The data includes employees of all three branches of government, higher education institutions, and quasi-public agencies.

Earlier this month, GOVERNING magazine reported that there hasn’t been much growth in the government sector nationwide – both federal and state governments – even as other sectors of the economy are reflecting positive growth as compared with a year ago.

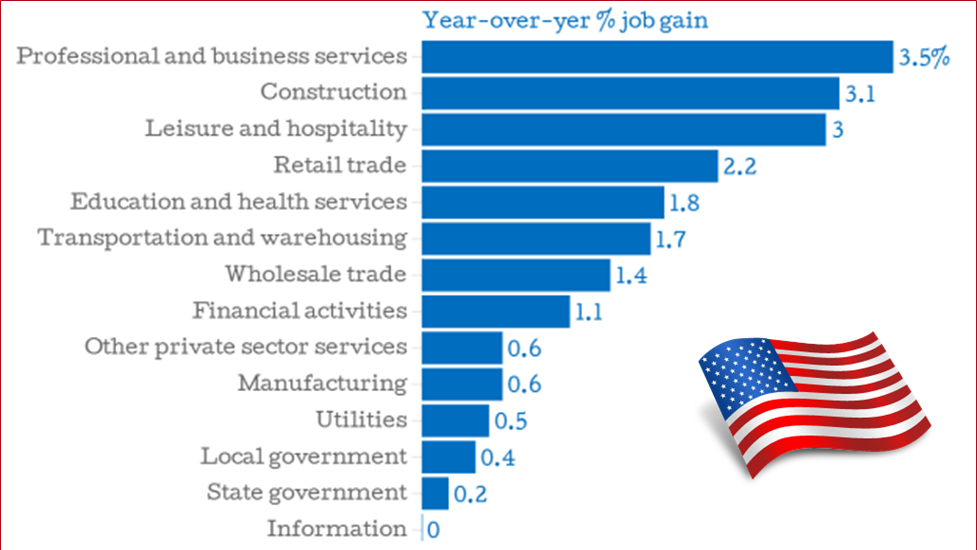
A few of the nation’s larger industries have fared better than others, such as professional and business services (+3.5 percent) and construction (+3.1 percent). Total non-farm employment increased by 1.7 percent. Picture1

Meanwhile, state and local government employment hasn’t budged, the magazine reported, increasing just 0.2 and 0.4 percent, respectively. The federal government has shed an estimated 92,000 positions, a reduction of 3.3 percent.  The Labor Department reported this month that the national unemployment rate fell to 7 percent in November – a five-year low.

In Connecticut, it has been widely reported that state government had about 1,200 fewer full-time equivalent positions mid-year 2013, compared with January 2011.

Charts:  Office of Legislative Research, GOVERNING magazine

Newtown High School Students Win International Public Health Education Contest

Each year, about 3.5 million children die before their 5th birthday due to preventable diseases, mainly diarrhea and acute respiratory diseases.   According to survey data from the Global School-based Student Health Survey, over 15 percent of schoolchildren in some countries say they rarely or never wash their hands before eating.

Those facts spurred a group of Newtown High School student to action.  They participated in the World Health Organization’s Touching Lives School Talent International Contest.  The onewtown highne-minute educational video they produced was selected by a jury of international experts as the winning entry in the middle/high school age category (age 10-16) and was the only United States-based entry to win its category.

The Newtown Public Health class submitted the video at the start of the school year, and it was selected this fall among the winners in various age categories.  Their video now appears on the website of the Pan American Health Organization, and has begun to appear on other public health websites, including the Connecticut Public Health Association.  It was designed, written and pan americanproduced in the opening weeks of school, just prior to  the mid-September entry deadline.

Experts point out that “just rinsing your hands is not washing.” In order for hands to be clean, soap and water must be used, for at least 20 seconds. Handwashing with soap is the most effective and inexpensivsinke way to prevent diarrheal and acute respiratory infections. Together, they are responsible for the majority of all child deaths, officials report.

Turning handwashing with soap before eating and after using the toilet into an ingrained habit could save more lives than any single vaccine or medical intervention, cutting deaths from diarrhea by almost half and deaths from acute respiratory infections by one-quarter, experts predict.  They also point out that a vast change in handwashing behavior is critical to meeting the Millennium Development Goal of reducing deaths among children under the age of five by two-thirds by 2015.

The educational video is preceded with the words “A Message from Newtown High School’s Public Health Class” filling the screen. It then begins with a male student gently singing over a strumming guitar, reminding viewers of the importance of hand-washing in rhyming lyrics, including urgintv monitorg viewers to “always think, 20 seconds at the sink.”  The video then features a variety of voices repeating “20 seconds” in nearly a dozen world languages.  It concludes by suggesting “don’t be part of the problem, be part of the solution.”

The video was edited by Amylee Anyoha.  Students in the Newtown High Public Health Class included Jess Amante, Maddie Erhardt, Enea Musaka, Sarah Craig, Kelly O’Connell, Chris Beaurline, Sydney Allen, Gabby Durkin, Tim Krapf, Amanda Paige, Taylor Strolli and Heather McKeown.

In the 2013 #TouchingLives School Talent International Contest, students could work individually or in a group, and all the countries in the Americas, were eligible and encouraged to develop songs, videos, illustrations, written compositions or any other expression of art promoting hand washing. The contest was, according to organizers, “about giving your personal touch to change the world.”

Pediatrician’s Invention to Stop Pain of Injections Could Improve Public Health

Many parents bring their infants and young children to the doctor for injections and leave muttering “there’s got to be a better way,” their child in tears or traumatized by the shot – or shots – administered to prevent illness and disease.  When Amy Baxter left the pediatrician’s office with her youngster, she resolved to find that better way.

Baxter, who attended Yale University as an undergraduate, Emory Medical School, and is now an emergency pediatrician, pain researcher and inventor in Atlanta, successfully developed  - with financial support from the National Institute of Health – a game-changing  device that combines high frequency, low amplitude vibration and a unique reusable ice pack a combination sAmy Baxter ATLpecifically designed to remove pain from the injection.

By stimulating competing sensations, nerve transmission of sharp pain, itching, or burning is blocked.  Simply put, the shots don’t hurt – and independently verified research indicates that it works.

As inventor of the unique needle pain blocking device - called Buzzy - Baxter founded a company that manufactures and distributes the product nationwide.  It is now in 1,200 children’s and adult hospitals across the country, including Yale-New Haven Hospital, Connecticut Children’s Medical Center, and Lawrence & Memorial Hospital in New London,  and it is being used in Connecticut, with varying frequency, by about 100 physicians in medical practices all across the state, from Ashford to Westport.

Buzzy is a bee-shaped palm sized device (wings included) that appears as cute as a toy but has a more important mission – to alleviate pain, thus eliminating the onset of fear. Baxter’s company, Georgia-based MMJ Labs, produces the fast, effective solution– which has applications beyond children, and beyond injections, to other ailments and sources of quick, sharp pain.

Since its launch in 2009, Buzzy has amassed more than 36,000 users, $1 million in annual revenue, and rapidly increasing sbuzzy shotales.  Baxter is one of Inc. Magazine’s Top Women in Tech to Watch, and is asked all over the world to educate physicians, nurses, Child Life specialists, and others about the importance of pain management.
“I invented Buzzy after experiencing first-hand the indifference of the healthcare system to the pain and suffering of children. As a pediatric emergency physician and pain researcher, I have learned that pain relief is not just a luxury; it actually improves the outcomes of procedures,” Baxter explains.

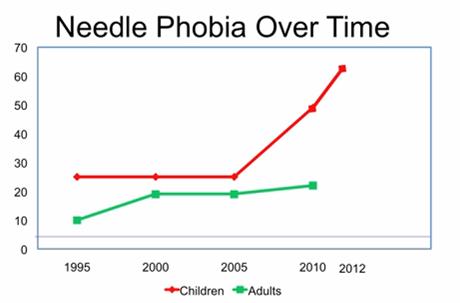
Data indicates that fear of needles is growing among children and the general population, and Baxter says that’s reason for concern.  Especially troubling is the long-term impact of a growing population oneedle phobia over timef needle-averse adults will have on their own health and the health care system.
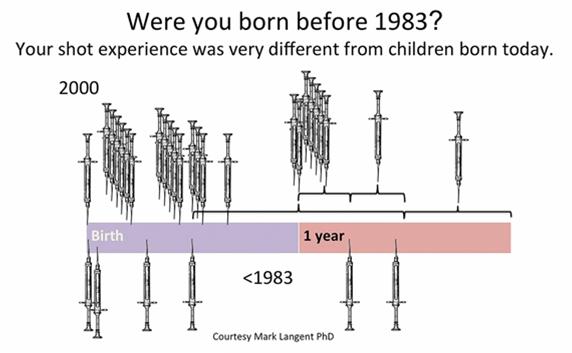
She cites statistics that reflect a dramatic increase in the number and frequency of shots children receive as youngsters – as much as four times higher than 50 years ago – and sometimes as many as four or five shots in a single doctor’s office visit.  And she stresses that pediatricians generally do little or nothing to try to diminish the pain that accompanies those injections.  That, Baxter says, has dramatic and long-lasting effects, on children as well as their parents.   The youngsters come to view the visits as more about pain than health, and the parents begin to have second thoughts about continuing to inflict the pain of needles on their children, often regardless of the potential benefits.

In a TEDx talk in Atlanta last month, Baxter discussed the public health repercussions of having populations whose fear of vaccinations could turn them shotsaway from the very remedies that can improve their individual health and the health of entire populations, warning that “by ignoring pain we’re endangering the future of health care.”

In the talk, titled “Pain, Empathy and Public Health,” Baxter warned that “the number and the way were giving shots is causing needle fear” which may lead to today’s children electing to stay away or delay visits to doctor’s offices as adults – at considerable potential health peril.

In the face of a potential “public health tsunami,” Baxter says “the solution is not to stop vaccinating, it’s to start making the shots better— vaccines shouldn't have to hurt.”

Two-Thirds of Drivers Use Cell Phones While Driving Despite Dangers, Survey Says

It turns out that the problems is much greater than just teens.  Texting while driving – like texting – is cutting across the population, presenting dangers that are well-documented and increasingly ignored.  And it’s not only texting – it is the use of phones while driving as well that is causing concerns among safety experts.

New research from the AAA FoundOLYMPUS DIGITAL CAMERAation for Traffic Safety indicates that high school-aged teens report using their phones or texting while driving substantially less often than adults do.  The AAA survey found that adult drivers ages 25-39 were the most likely to admit engaging in these risky behaviors behind the wheel.
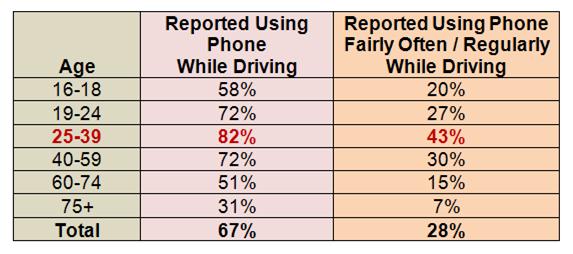
Though the practice is hazardous at any age, two out of three drivers reported using a cell phone while driving within the past month. Forty-three percent of adults ages 25-39 reported doing so fairly often or regularly while driving, compared to only 20 percent of teens.  Motorists age 60 and up were the least likely to report using a phone.

“Using your phone while driving may seem safe, but it roughly quadruples your risk of being in a crash according to previous research,” said Stephen Rourke, manager of driving school administration for AAA. “None of us is immune from the dangers of distracted driving. The best advice is to hang up and drive.”AAA age

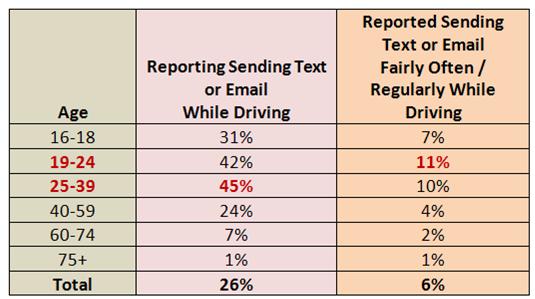
More than one-in-four motorists reported sending a text or email while driving within the past month. Adults ages 25-39 reported texting and driving most frequently, while those age 60 and up reported doing it the least.

According to the National Highway Traffic Safety Administration, one out of every ten fatal crashes involves distraction, resulting in more than 3,000 deaths per year, although experts agree the numbers are likely underestimated.

Previous research shows that hands-free cell phones offer no significant safety benefits over handheld phones – hands-free is not risk-free.  Earlier this year, Connecticut by the Numbers reported on a proposal in Connecticut to ban the useAAA text chart of electronic devices in vehicles.

The AAA Foundation for Traffic Safety collected the data as part of the 2013 Traffic Safety Culture Index. The data are from a sample of 2,325 licensed drivers, ages 16 and older, who reported driving in the past 30 days.

Connecticut Receives "F" in Report Card on High School Financial Literacy Requirements

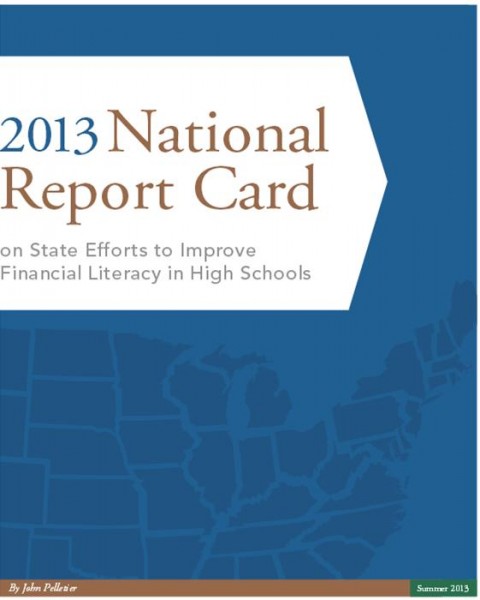
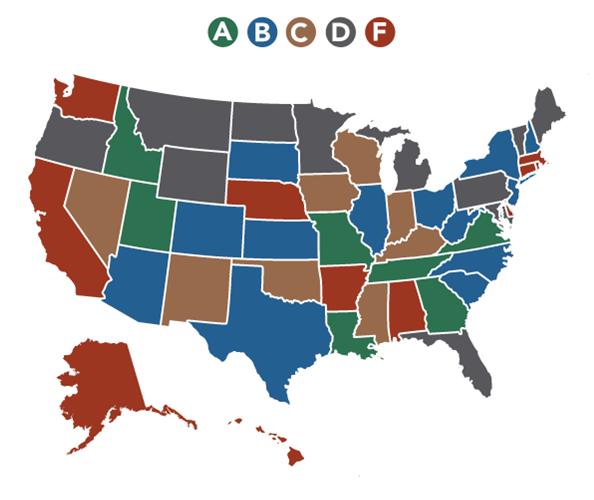
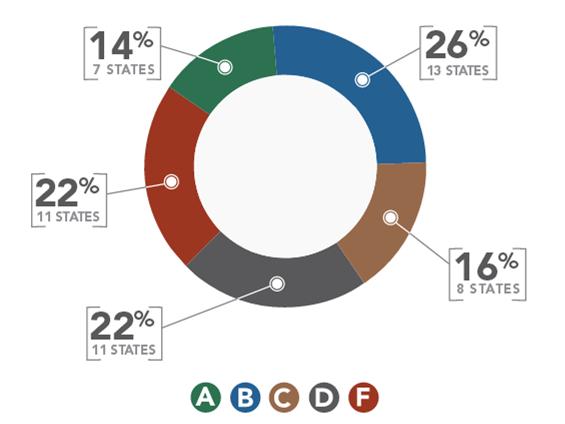
Connecticut received a resounding F in a state-by-state Report Card of financial literacy education requirements at the high school level, according to a study by the Center for Financial Literacy at Champlain College in Burlington, Vermont.cover

Connecticut is one of 11 states to receive a failing grade.  The others were Alabama, Alaska, Arkansas, California, Delaware, Hawaii, Massachusetts, Nebraska, Rhode Island and Washington.  Those states, according to the report, “have few requirements, or none at all, for personal finance education in high school.”

USA grade mapOverall, 60 percent of states received a C, D or F while 40 percent of states received an A or B grade.  Among those at the head of the class, receiving an A, were Georgia, Idaho, Louisiana, Missouri, Tennessee, Utah and Virginia.  Four of those states – Virginia, Utah, Tennessee and Missouri – require a one-semester standalone course in personal finance as a graduation requirement.
The report, 2013 National Report Card on State Efforts to Improve Financial Literacy in High Schools, indicated that in Connecticut:

  • Personal finance topics are included in the state’s educational guidelines but the state does not require that local school districts teach these topics. (Source: CEE Survey)
  • No personal finance requirement, although personal finance may be taught at certain schools as an elective. (Source: Jump$tart Survey)
  • Since 2007 Connecticut legislators have introduced seven bills in an attempt to bring financial literacy into their schools. All attempts have failed. In 2009 the state passed a law allowing banks to open branches in schools to help students learn about saving money. (Source: NCSL Summaries)

The report suggests four key elements to a successful financial literacy program at the high school level:

  1. Requirement: Financial literacy topics must be taught in a course that students are required to take as a graduation requirement.states circle
  2. Training: Teacher training is critical.  To effectively educate our students about personal finance, we need confident, well-trained educators.
  3. Funding: Funding is needed to ensure that these classes are offered to all high school students.
  4. Assessed:  In order to make sure that the high school classroom personal finance training is working, we need to give students standards assessments on knowledge and behaviors.

Noting the lack of financial literacy education across the country, the report indicates that “for our nation’s youth, learning is often being down through personal experience.  Making mistakes with your credit is a painful way to learn a life lesson.”  The report’s introduction also notes that “to improve personal finance outcome for American citizens, our nation must be educated in personal finance… In too many of our states, our youth receive little if any personal finance training in middle school, high school and college.”

Nonprofits Nationally Suffer From Late Government Payments, CT Tackling Issue

Connecticut is one of eight states that has begun to respond to a serious problem facing nonprofit organizations in a time of tight budgets and reductions in state funding:  late payments and duplicative requirements by government agencies.  A new report from the Urban Institute says the problem – which grew more serious during the recession – may be easing somewhat, but still has a way to go.

The 57-page report, “Nonprofit-Government Contracts and Grants:  Findings from the 2013 National Survey,” indicated that “Joint government-nonprofit working groups in Connecticut, Hawaii, Illinois, Maine, Maryland, New Jersey, New York, and Texas are tackling issues, such as duplicative documents and audits and late payments, with the goal of improving government processes and the ability of nonprofits to win and successfully implement contract and grant requirements.”

The data, according to the report, is “a sobering reminder that human service nonprofits are continuing to wait extended periods of time for payments.”  The national survey indicates that 22 percenonprofit report covernt of nonprofits received payments 61-90 days late from local governments, 24 percent from state governments and 20 percent from the federal government – all increases from 2009 survey data.  The number of nonprofits experiencing late payments of more than 90 day dropped slightly for local and state government payments, but grew slightly for federal government payments.

The Urban Institute report outlined a series of recommendations for governments and nonprofits to improve systematic relationships; state-by-state data is due to be released next month.

A 22-member Connecticut panel appointed by Gov. Dannel Malloy, in a report issued last fall, found that “some state agencies do not pay contractors in a timely manner consistent with agreed upon timeframes and thereby create additional hardship and costs of borrowing for nonprofit service providers.”

The group recommended that “the State of Connecticut adopt Principles to Guide the State-Private Nonprofit Provider Partnership, intended to promote a fair, effeCT Report coverctive, responsive, transparent and accountable partnership between nonprofit providers and their state government funders.” It also called for revisions to the state’s procurement standards, streamlining data gathering, and “payment rates that cover the true cost of services.”

Nationally, nearly half of organizations reported that they experienced limitations on the percentage of government funds that could be used for program and organization administration costs. Approximately one-quarter of organizations with a contract indicated that they had to share in the cost of the contract and one-half of grantees said they had a matching requirement associated with a grant.

Reflecting the fiscal challenges faced by nonprofits, the report found that “more than 40 percent of respondents turned to their reserves to make ends meet and about 25 percent of nonprofits reduced the number of employees on their payroll. About 14 percent of organizations reduced the number of clients served and almost 11 percent cut programs.”  In addition, 21 percent of respondents nationwide said their experience with government contracts and grants was worse than in the prurban institute chartevious year, while 6 percent said it had improved.
The report concluded that “all types of nonprofits reported problems with late and insufficient payments, complex and burdensome application and reporting processes, and changes made to contracts and grants after they have been approved.”

Late payments have the biggest impact on human-service and health organizations, which receive the lion’s share f all government spending on nonprofits, the Chronicle of Philanthropy reported. Overall, the national study found that:

  • government agencies entered into approximately 350,000 contracts and grants with about 56,000 nonprofit organizations;
  • on average, nonprofits have six contracts and/or grants per organization; the median is three; and
  • governments paid $137 billion to nonprofit organizations for services (in 2012)

The Urban Institute is a nonprofit, nonpartisan policy research and educational organization that examines the social, economic, and governance problems facing the nation.

CT, NY, NJ Should Expect Unprecedented Flooding by Mid-Century, Scientists Predict

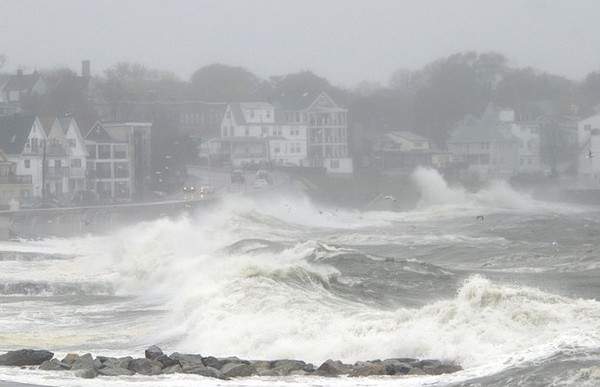
It will get worse, not better, for shoreline residents and businesses in Connecticut, New York and New Jersey within range of the Atlantic Ocean.  That’s the likely scenario based on newly completed research by a team of geoscientists who are predicting that the New Jersey shore will likely experience a sea-level rise -- about 1.5 feet by 2050 and of about 3.5 feet by 2100 – that will be 11 to 15 inches higher than the average for sea-level rise globally over the century.

Hurricane Sandy Bears Down On U.S. Mid-Atlantic CoastlineThat would mean that by the middle of this century, the one-in-10 year flood level at Atlantic City, for example, would exceed any flood level seen previously, including the natural disaster that was Superstorm Sandy.  The scientists suggest, based on their research, that “planners should account for rising sea levels,” noting that “where the consequences of flooding are high, prudent planning requires consideration of high-end projections” outlined in their study.

Geoscientists at Rutgers University and Tufts University base their projections in part upon an analysis of historic and modern-day records of sea-level rise in the U.S. mid-Atlantic region. Their research appears in the inaugural issue of the journal Earth's Future, published this month by the American Geophysical Union (AGU).

While much to the work centers on the New Jersey shore and The Battery in Lower Manhattan, Rutgers researcher Ken Miller told Connecticut by the Numbers that their analysis included both Montauk on Long Island and Bridgeport.  Since Connecticut lies on bedrock, Miller said, it will largely behave like The Battery in New York CityAGU logo.  “I believe that the projections for bedrock locations are applicable throughout Connecticut,” said Miller, a professor of earth and planetary sciences in Rutgers' School of Arts and Sciences. shore map
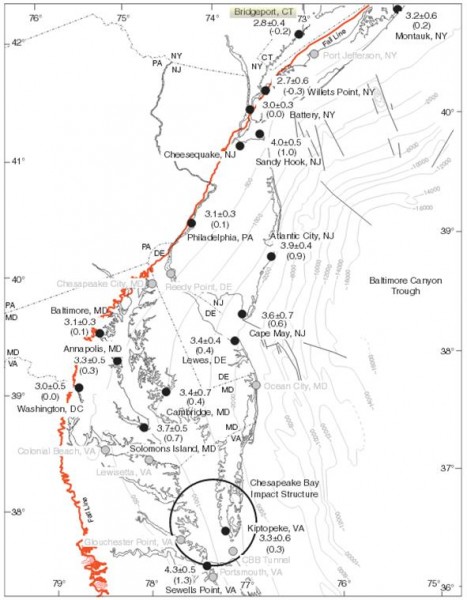
Miller collaborated in the study with colleagues Robert Kopp, Benjamin Horton and James Browning of Rutgers and Andrew Kemp of Tufts. Kemp, an assistant professor of earth and ocean sciences at Tufts since May, joined the faculty from Yale University, where he was a Postdoctoral Associate at the Yale Climate and Energy Institute (YCEI).  The new research builds upon a recent study by Kemp, Horton and others that reconstructed a 2,500-year record of sea level at the New Jersey shore. Horton is a professor of marine and coastal sciences in Rutgers' School of Environmental and Biological Sciences.

"It's clear from both the tide gauge and geological records that sea level has been rising in the mid-Atlantic region at a foot per century as a result of global average sea-level rise and the solid earth's ongoing adjustment to the end of the last ice age," Miller told Rutgers Today. "In the sands of the New Jersey coastal plain, sea level is also rising by another four inches per century because of sediment compaction -- due partly to natural forces and partly to groundwater withdrawal. But the rate of sea-level rise, globally and regionally, is increasing due to melting of ice sheets and the warming of the oceans."

The researchers suggest that “additional work is needed to integrate site-specific sea-level rise projections with storm tide statistics to guide planning decisions and investments that may have time frames of 20 years, 40 years, or longer.”  They indicate that sea-leEarth's Future covervel rise in the mid-Atlantic region also results from changes in ocean dynamics. The researchers said sea-level rise could be higher -- 2.3 feet by mid-century and 5.9 feet by the end of the century -- depending on how sensitive the Gulf Stream is to warming and how fast the ice sheets melt in response to that warming.
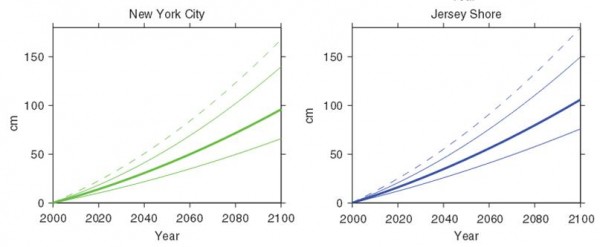
The study found that the eight inches of climate change-related regional sea-level rise in the 20th century exposed about 83,000 additional people in New Jersey and New York City to flooding during 2012's Superstorm Sandy.  The research was supported by a grant from the National Science Foundation.

Earth’s Future, with its inaugural issue, joins AGU’s prestigious portfolio of peer-reviewed research publications, including Geophysical Research Letters and Journal of Geophysical Research – Atmospheres. Both are ranked among the top ten most-highly cited research publications on climate change over the past decade.  The American Geophysical Union is dedicated to advancing the Earth and space sciences for the benefit of humanity through its scholarly publications, conferences, and outreach programs. AGU is a not-for-profit, professional, scientifinyc njc organization representing more than 62,000 members in 144 countries.