Towns and Cities Look to Varied Housing Options, Community Engagement

Many municipalities across Connecticut and New England are finding that community engagement – proactively, thoughtfully and creatively asking their residents for their attention and ideas about proposed housing and commercial development – pays off big time. That was evident last month at UMass/Amherst when three federal agencies – HUD, EPA and DOT – along with the Funders’ Network for Smart Growth and Livable Communities brought together experts and advocates from the region to discuss the best ways to merge affordable housing creation, transit and livable, sustainable and environmentally sound practices.

A growing number of organizations and government entities – municipal and regional – are using or promoting community engagement because the changing housing market is moving many more communities to increase their efforts at housing creation. A wider array of housing options – smaller, denser, more affordable, energy-efficient, walkable and, if possible, close to transit – are being utilized to meet the needs of empty-nesters, young professionals and families, and workers in a region that, despite a falloff in demand, has seen rental and purchase prices remain very high.video clip

The Partnership for Strong Communities highlighted community engagement strategies it promotes, including its new video about five very different Connecticut communities – Hamden, Old Saybrook, Colchester, Bristol and Simsbury – that have used an array of community engagement methods – charrettes, town meetings, websites and crowd-sourcing among them – to harvest ideas and achieve buy-in for their development plans.

The organization embarked on a search to discover how communities can balance multiple priorities and opinions, and achieve development that most residents can be satisfied with.  Partnership staff drove around the state and filmed interviews with about 30 individuals involved in this work.  The resulting video, along with supporting materials, reflects how five different communities with different goals, used different methods to achieve a single outcome.

International Students Are Half of UConn MBA Class of 2013

The Class of 2013 student profile for the University of Connecticut’s School of Business provides interesting insight into those going through UConn to make their mark on the business world.  The university’s website reports the stats are an indication of the program’s “success in recruiting top-notch talent from a myriad of backgrounds.”  Of particular note:

  • 69% of the students are male, 31% are female
  • 50% are from the United States, 50% are international students
  • Among the states represented are Connecticut, Florida, New Jersey, New York, Utah, Virginia and Wisconsin
  • Among the nations represented are China, India, Japan, Serbia, Taiwan, Thailand, Vietnam and the U.S.
  • The undergraduate degrees of the MBA students are 31% business, 21% humanities/social studies, 17% engineering, 11% math/physical science, 7% economics, and 2% information science/computer science.2010class_ugdegree
  • The average years of work experience is 5.1
  • The average age is 28

The UConn School of Business was recently ranked among the Top 40 programs in North America and Top 200 worldwide for three graduate programs. The rankings were awarded by Eduniversal's Top 200 "Best Masters and MBA Worldwide" 2012-2013, which provides a global overview of the best post-graduate programs in 30 specializations in 153 countries. The programs and rankings were:

All of which are numbers and notoriety to ponder when encountering students coming and going from UConn's distinctive School of Business in downtown Hartford.

Sustainability, Green Infrastructure Advance in CT

green-energyWhen considering Connecticut’s progress in sustainability, green infrastructure, and green investments, a variety of statistics help to tell the story.  Among them:

  • The U.S. Department of Energy considers 13 percent of Connecticut’s electricity as coming from renewable resources, ranking the state 31st in the nation.  The majority of the renewable power comes from biomass and hydropower, as reported in the Connecticut Green Guide (www.CTGReenGuide.com).
  • Connecticut’s transportation sector employees more green workers than any other industry in the state, with 8,238 green jobs.
  • In the Northeast, 76 percent of companies use at least one type of green technology or practice.  According to the U.S. Bureau of Labor Statistics, the most popular green methods are:
  1. Energy efficiency
  2. Waste reduction
  3. Conserving natural resources
  4. Reducing greenhouse gas emissions
  5. Removing pollutants from workspace
  6. Generating onsite renewable energy
  • Connecticut Innovations, the state’s quasi-public investment firm, currently puts 6 percent of its portfolio into clean technology start-ups.  Here’s the portfolio breakdown:
  1. Information technology               49.5%
  2. Bioscience                                           42%
  3. Clean tech                                           6%
  4. Photonics                                            2%
  5. Advanced materials & other       .5%


  • The U.S. Energy Information Agency reports that Connecticut ranks fifth in the nation among the states consuming the least amount of energy per capita.  The top ten:
  1. Rhode Island
  2. New York
  3. Hawaii
  4. California
  5. Connecticut
  6. Massachusetts
  7. Arizona
  8. New Hampshire
  9. Florida
  10. Vermont


  • Connecticut leads the New England states in demand response resources – businesses and facilities that power down when electric prices and demand spikes, according to data from ISO New England.

State                                     Megawatts of Demand Response

Connecticut                        996.6Picture1

Massachusetts                  800.5

Maine                                   447

New Hampshire              183.2

Vermont                              144

Rhode Island                      140


Among the most common practices used by employers are asking employees to conserve, turn off or dimming lights, adjusting indoor temperature, and turning off equipment such as printers, copiers, and PCs).  Other steps, used less often, include shutting down production, starting emergency generation, limiting the use of elevators and escalators, and shutting down an entire plant.


Foreclosure Rate Drops Nationally, CT Better Than National Average

Foreclosure filings — default notices, scheduled auctions and bank repossessions — were reported on 150,864 properties across the U.S. during January, a decrease of 7 percent from the previous month and down 28 percent from January 2012. The report - by RealtyTrac®, a leading online marketplace for foreclosure properties and real estate data - shows one in every 869 U.S. housing units with a foreclosure filing during the month, down 28 percent from a year ago to the lowest level since June 2006 — a 79-month low. Each of Connecticut’s eight counties is below the national average, and the state continues to be outside the top 10 states for the number of foreclosures, according to the U.S. Foreclosure Market Report™ for January 2013.  The prevalence of foreclosures, based on the number of housing units, was greatest in Windham, Tolland, and New Haven Counties.

The Florida foreclosure rate ranked highest among the states for the fifth month in a row. One in every 300 Florida housing units had a foreclosure filing in January — more than twice the national average. A total of 29,800 Florida properties had a foreclosure filing during the month, up 12 percent from the previous month and up 20 percent from January 2012.MapPic_000918

With one in every 344 housing units with a foreclosure filing in January, Nevada posted the nation’s second highest foreclosure rate for the fourth consecutive month. A 32 percent month-over-month jump in scheduled foreclosure auctions helped the Illinois foreclosure rate rise to third highest among the states in January. One in every 375 Illinois housing units had a foreclosure filing during the month.

Other states with foreclosure rates among the nation’s 10 highest were Arizona (one in 501 housing units with a foreclosure filing), Georgia (one in 513 housing units), Ohio (one in 612 housing units), Washington (one in 674 housing units), California (one in 753 housing units), Indiana (one in 784 housing units), and Michigan (one in every 837 housing units).

In Connecticut, New Haven County had the largest number of foreclosures in January, with 317, followed by Hartford County with 265 and Fairfield County with 193.  Overall, Connecticut had 5,187 home foreclosures during the month, with the average foreclosure sales price of $186,405.  The county-by-county breakdown:

  • Windham            51 foreclosure properties             1 in every 958 housing units
  • Tolland                 52 foreclosure properties             1 in every 1,109 housing units
  • New Haven        317 foreclosure properties          1 in every 1,138 housing units
  • Hartford               265 foreclosure properties          1 in every 1,409 housing units
  • Litchfield              57 foreclosure properties             1 in every 1,530 housing units
  • New London      78 foreclosure properties             1 in every 1,546 housing units
  • Fairfield                193 foreclosure properties          1 in every 1,865 housing units
  • Middlesex           37 foreclosure properties             1 in every 2,013 housing units

In New Haven County, the numbers were driven by Waterbury with 84 foreclosures and New Haven with 59.  West Haven had 38 during the month.  In Hartford County, there were 44 foreclosures in New Britain, 35 in East Hartford and 26 in Manchester, according to the data provided by RealtyTrac.

Connecticut Ranks #25 in Homelessness, Federal Data Shows

Connecticut ranked #25 in the nation in state-by-state comparisons of the homeless population in emergency and transitional shelters in each state, according to data compiled by the U.S. Census Bureau and reported in the AARP Bulletin. Earlier this week, The Hartford Courant reported that “volunteers and social service workers roved the streets for the U.S. Department of Housing and Urban Development's national ‘point in time’ homeless census, which provides more up-to-date data to consider along with the 2010 census data that was the basis of the state comparisons.

Mandated at least every other year, the ‘point in time’ count helps advocates and housing officials analyze trends in homelessness, determine who stays in the shelters and gain insight into why, despite a stronger government push to combat homelessness, people remain out in the cold, the Courant reported.

About 4,210 homeless people lived in the state in 2012, including men, women and children in emergency shelters and transitional housing, federal data show. Among the nearly 770 reported homeless in Hartford — the biggest homeless population of the state's urban centers — 141 were children, according to a report released Wednesday by the Connecticut Coalition to End Homelessness.

Latinos are overrepresented among clients using the state’s many homeless shelters, and they tend to be much younger, according to coverage of the report by ctlatinonews.com. “While Hispanic/Latino persons represent only 12.3% of the Connecticut population, they comprised 28 percent of all emergency shelter and 23 percent of all transitional housing clients.

“They also tended to be younger. The most common age of Hispanic/Latino emergency shelter clients was between 18-29 years old (29 percent), while that of non-Hispanic/Latino clients was 40-49 years old (31 percent).”

“Connecticut’s emergency shelters alone served 11,700 people, including more than 1,500 children. The number of people in shelters and transitional programs at any given point in time increased 3% from 2009 to 2010, while shelter bed usage has exceeded 100% during all of 2010 and much of 2009. While collectively we may have slowed the rate of growth in homelessness over time, the numbers continue to increase,” the report said.


Credit Card Debt Increases Among Older Residents

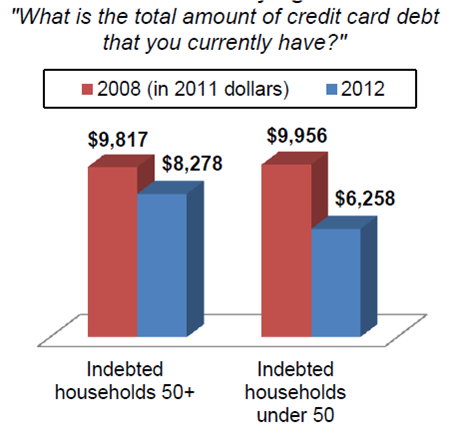
As Connecticut struggles to lift itself from a nagging recession and rebuild a shaky economy and grow jobs, new national data suggest that economic realities plus an aging population are combining to increase the credit card debt among a significant segment of the population. It has been estimated that the state's 65+ population would increase by 69 percent between 2000 and 2030. Middle-income Americans age 50 and older are carrying more credit card debt on average than younger people, according to a National Survey on Credit Card Debt of Low- and Middle-Income Households, released last month by Demos, a national policy think tank and AARP’s Public Policy Institute.

The results of the 2012 survey are a reversal of findings from a survey conducted by Demos in 2008.  It reveals a troubling picture of middle-income 50+ households carrying card debt near or in their retirement years.

The report shows that nationwide, older households carried an average credit card balance of $8,278 in 2012. For those underlogo 50, credit card debt averaged $6,258. Other key findings for middle-income households that carried credit card debt for three months or more:

  • A third of older households used credit cards to pay for basic living expenses such as rent, mortgage payments, groceries, or utilities.
  • Half of Americans age 50+ carried medical expenses on their credit cards. Prescription drugs and dental expenses were the main contributors.
  • A quarter of older households said loss of a job contributed to their credit card debt in the last three years.
  • Nearly one in five (18 percent) older Americans nearing retirement said they dipped into retirement funds to pay down credit card debt.chart
  • Older Americans were twice as likely as those under age 50 to take on credit card debt to assist other family members (23 percent vs. 11 percent).

This report suggests that credit card debt among older Americans is primarily a reflection of difficult economic times, not a lack of personal financial responsibility.  State-by-state data was not available.

The findings may help to explain the economic challenges facing Connecticut’s citizenry, which is on track to becoming one of the oldest among the states, expected to grow from 470,183 (13.8% of the total state population) in 2000 to 794,405 in 2030, constituting 21.5% of the projected total state population.


Connecticut to Receive National Support to Reduce Premature Births

With one in 10 babies born premature in the state, the National Governors Association (NGA) has targeted Connecticut and three other states for extra help in better developing and coordinating policies to reduce the rate of preterm births. NGA will convene in-state sessions with the selected states to facilitate this process and convene a networking conference for that group of states to share lessons learned and to further their respective planning processes. NGA has selected Kentucky, Louisiana and Michigan, along with Connecticut, to participate in a Learning Network on Improving Birth Outcomes. The goal is to assist states in developing, implementing and aligning their key policies and initiatives related to the improvement of birth outcomes, as measure by the incidence of preterm births and infant mortality.

Of the 41,000 babies born each year in Connecticut, about 4,000 are born preterm. The median gestational age for these babies is 35 weeks -- about a month earlier than the median 39 weeks for a full-term birth. These babies typically weigh 5.5 pounds compared with the full-term rate of 7.5 pounds.

The Learning Network will focus on demonstrated best practices of states that have improved birth outcomes. Participating states will learn about coordinating activities across agencies and options to accelerate the pace of improving outcomes and reducing costs.

The nation's premature birthrate is 11.7% of all live births — the lowest in a decade, according to figures from the National Center for Health Statistics. The March of Dimes has set a goal of 9.6% by 2020.  Nationwide, key signs of improvement in the report issued late last year:

  • Four states (Vermont, Oregon, New Hampshire and Maine) earned an "A" for meeting the 9.6% goal; in 2010, only Vermont earned the top grade.
  • Connecticut, at 10.1%, received a “B” in the report.
  • 45 states, the District of Columbia and Puerto Rico posted improved preterm birthrates from 2009march of dimes map to 2011, earning 16 of them better grades.
  • The states with the highest preterm birthrates — Mississippi (16.9%), Louisiana (15.6%), Alabama (14.9%) — are among 48 states, along with Puerto Rico (17.5%) and the District of Columbia (13.7%) that have all formally set goals to lower their preterm rates 8% by 2014 from their 2009 rates.

Connecticut's rate of pre-term births also reflect a racial and ethnic disparity. The pre-term rates are 14 percent among black/African Americans, 12 percent among Latinos and 9.4 percent among whites, according to the state Department of Public Health.

The initiative  is part of the Alliance for Information on Maternal and Child Health Services (AIM). AIM is sponsored by the Maternal and Child Health Bureau of Health Resources and Services Administration of the United States Department of Health and Human Services.

Premature birth is associated with infant mortality as well as a greater risk of learning disabilities and lifelong hearing and visual problems. Some of the major risk factors for having a premature baby are smoking during pregnancy and having a pre-existing medical condition, such as diabetes or hypertension, officials said.

Population Growth Through 2025 Driven by New Haven, Hartford, Fairfield Counties

Connecticut’s population, which was just under 3.3 million in 1990 and just over 3.5 million two decades later, is projected to exceed 3.7 million by 2025, according to Connecticut Population Projections featured on the University of Connecticut’s Connecticut State Data Center website.CT Map The interactive site provides a breakdown of projections for each of the state’s eight counties – and all are expected to grow during the next dozen years.  The most dramatic growth is anticipated in New Haven County, which is seen to exceed 900,000 residents for the first time by 2025.  The state population is predicted to increase by slightly more than 100,000 residents between 2015 and 2025.

Overall, the state’s population is expected to reach 3.66 million by 2015 and grow to 3.74 million by 2025.  Litchfield County will likely see the slowest growth, with less than an additional 1,000 residents anticipated over the decade.  Middlesex County is expected to grow by about 2,000 residents; Tolland County by nearly 5,000.  Windham County is expected to grow at twice the rate of New London County, as both are anticipating adding between 6,000 and 7,000 residents, although New London County has more than twice the population.

Here’s the breakdown by county of the projections:

County                   2015                       2025                       Projected growth

Fairfield                 932,378                 954,479                 22,101

Hartford                 910,921                 936,811                 25,890

New Haven            881,371                 912,057                 30,686

New London         279,756                 285,773                 6,017

Litchfield               192,189                 193,113                  924

Middlesex             168,834                 170,976                  2,142

Tolland                   155,924                 160,760                  4,836

Windham               122,719                 129,526                   6,807

Connecticut          3,644,546              3,746,184              101,638

The ranking of the state’s eight counties by population is not expected to change:  Fairfield, Hartford, New Haven, New London, Litchfield, Middlesex, Tolland, and Windham.

The Connecticut State Data Center provides population projections to assist state agencies, non-profit organizations, businesses, governments, and centers/organizations to identify potential population changes into the future. These projections are created based upon several datasets and while these estimates are developed based on multiple data sources, actual population changes may vary from these projections.

Charter Oak Cultural Center Sees Opportunity in Dollar-for-Dollar Match

For those familiar with the remarkable work of the Charter Oak Cultural Center, time is running out on a unique opportunity to support the dynamic organization’s exceptional community initiatives.  An anonymous donor has agreed to match contributions made to support the work of Charter Oak, dollar for dollar, up to $100,000 - through the end of this month. That means every contribution made by January 31 will be doubled.  For an organization that is brimming with distinctive and impactful programming ideas but often scrambling for sufficient resources, it is a chance to see more dreams become reality.

Charter Oak Cultural Center, a magnificent and historic landmark and vibrant arts center on Charter Oak Avenue just off Main Street in Hartford, contributes to the revitalization of the city by bringing the community together through open and equal COCCaccess to the arts, through a deep commitment to social justice. The three main goals that characterize the organization’s mission are:

  • To provide wide access to the arts for all who wish to engage in them, regardless of income
  • To do the work of social justice through the arts
  • To celebrate the heritage of our historic building and to preserve it in perpetuity.

To realize that mission, Charter Oak provides over 1,000 underserved Hartford children with free, sophisticated arts classes and regularly makes professional performances – dance, theatre, concerts – and film and visual arts exhibits accessible to all.  In addition, Charter Oak recently started Connecticut’s first “street paper,” a newspaper written by people who are or were homeless. They’ve also introduced other educational and employment opportunities for those without homes. Their Youth Art Institute has been selected as a finalist by the President’s Committee on the Arts and Humanities, distinguishing it as one of the top arts and humanities-based youth programs in the country.

Charter Oak is seeking public support to allow them to take full advantage of what they’ve described as an “incredible offer” and “huge opportunity.”  Interested individuals can make a secure gift online, or mail a check to Charter Oak Cultural Center, 21 Charter Oak Avenue, Hartford, CT 06106.

There is more information about Charter Oak’s programming, which falls into four main categories, on the organization’s website.  The programs areas include:

  • Youth Arts Institute:   Reaches nearly 1,000 of Hartford’s inner-city children, ages 6 through 18, with arts and literacy-based classes held after-school, during-school, and in the summer, as well as evening programs for families.  The classes, along with nutritious meals and snacks, are provided free of charge. The youth programming successfully integrates the arts with academic subjects and assessments show that on average, participating students show a 54% improvement over the course of the semester in their ability to meet the state’s Arts K-12 Goals and Standards.
  • Professional Programming: Charter Oak hosts cutting-edge, thought-provoking visual and performing arts exhibitions and performances. As a matter of policy, they offer as many performances and events as possible for free, keep prices low and never turn anyone away who cannot afford the price of a ticket.  In the course of a year, they present over 100 professional events that include every variety of performing art—dance, film, theatre, concerts and more.  In two on-site galleries, both emerging and established artists from various cultural backgrounds exhibit their work.
  • Social Justice Programming: Charter Oak offers a number of programs that focus on social justice and equality- raising awareness about important issues and/or serving individuals in need- all through the lens of the arts.  For example, Charter Oak Cultural Center developed and launched Connecticut’s first “street paper,” entitled Beat of the Street, designed and sold by individuals experiencing homelessness.
  • Historic Preservation: When it was built in 1876, the temple on Charter Oak Avenue became the first building in Connecticut’s history to be constructed specifically as a synagogue.  Today, as the home of the Charter Oak Cultural Center, it is a vibrant hub for the community that provides programming for thousands of Hartford and Greater Hartford students, families and individuals each year.  The historic landmark is maintained and preserved as a vibrant resource for the community.

Learn more at www.charteroakcenter.org or 860.249.1207.


Three Cities Selected for Program to Bring Housing Downtown

Connecticut Main Street Center (CMSC) has selected Middletown, Torrington and Waterbury for its new pilot program, Come Home to Downtown. CMSC developed the mixed-use real estate planning pilot program to provide selected communities with new tools to strengthen economic health and restore vitality to their downtowns, facilitating the development of viable, interesting housing opportunities while improving downtown neighborhoods. The goal of the Come Home to Downtown program is to set the stage to attract developers and “mom and pop” building owners to redevelop vacant or underutilized buildings with a mix of uses and housing choices. CMSC will also provide local public and private champions and partners with strategic tools to aldowntownlow them to create or enhance a strong downtown management program.  The Come Home to Downtown pilot was created in partnership with the Connecticut Housing Finance Authority (CHFA), through a $250,000 investment using Community Investment Act (CIA) Program funding.

“Our Come Home to Downtown pilot communities were selected based on criteria we feel is vital for success, including local public and private sector leadership, a strong record of community engagement, success of previous downtown revitalization initiatives and multi-story buildings and property owners who are motivated to redevelop them,” said CMSC’s John Simone.

CMSC will work in concert with Middletown, Torrington and Waterbury, beginning with the collection of data, building analysis and the coordination of community engagement activities, exploring their downtown redevelopment issues in-depth and creating new strategies that respond to changing demographics and market dynamics.  Work will continue throughout the summer on consensus buiphoto_center_01lding, a downtown development audit for each of the towns, model building analysis, assistance to small-property owners who demonstrate a desire to redevelop their properties to include housing, and downtown management organizational development.

Connecticut Main Street Center is a statewide nonprofit that inspires great Connecticut downtowns, Main Street by Main Street. Its mission is to be the champion and leading resource for vibrant and sustainable Main Streets as foundations for healthy communities.