Volatility Seen by High Net Worth Investors; Connecticut Views Differ From Region, Nation

Connecticut’s high net worth investors, coming off a year of substantial profits from Wall Street, remain optimistic, if cautious, about 2014.  There are, however, distinct differences in how and where they view investment opportunities, as compared with investors nationwide, and even compared with those in neighboring New York and New Jersey.

A newly released survey conducted for Morgan Stanley Wealth Management, found that high net worth investors – those with $100,000 or more in investable household financial assets – were both realistic and optimistic about the immediate investment horizon, according to Bradley Barber, Executive Director and Family Wealth Director for Morgan Stanley Wealth Management serving coastal Connecticut, based in Greenwich.Bradley Barber low res

The survey reflects “cautious optimism,” Barker said, indicating that investors understand that the 30 percent returns of 2013 are not likely to be repeated this year, but that potential remains for solid gains.  “It’s a time to navigate the waters, not pull in the oars,” Barber told Connecticut by the Numbers.  “It is a market of stocks, not a stock market.  The high net worth investors surveyed were prescient about the volatility in the market we’ve seen since the first of the year.”

In the New York-New Jersey-Connecticut region, 86 percent of high net worth individuals said they expect their investment portfolios to be “better” or “the same” at year-end, and 84 percent believe their financial well-being will be the same or better.  At the same time, three-quarters of respondents said they were concerned about stock market volatility.  Among the top concerns of investors in the region are U.S. economic prospects (86%) and the federal budget deficit (83%).

Views on Industry Investment Potential Vary

There were also marked differences in the perceptions of investment potential for various sectors of the economy.  Those most favored as “good” investments nationally were technology (79% nationally, 72% in CT), energy (77% nationally, 66% in CT), bio-technology (63% nationally, 67% in CT), and pharmaceuticals (56% nationally, 61% in CT).  Connecticut policy makers have devoted financial resources to strengthening the state’s bio-technology industry in recent years, which may have contributed to the stronger upbeat attitudes here towards the sector as an attractive investment option.

The rocky national roll-out of the affordable health care act, and its comparatively smooth path in Connecticut, may also have been reflected in the survey findings.  Unlike the national results, thosmorgan stanleye surveyed in the tri-state area viewed healthcare among the favored sectors for 2014 - 55% “good” in the tri-state region vs. only 45% nationally.

Other industry sectors that have a strong presence in the state and region, however, did not fare as well.  Aerospace was seen as a “good” investment choice by only 25 percent of those surveyed, both nationally and in the tri-state region.  Insurance was viewed favorably by only 30 percent of high net worth investors, both in the region and nationwide.  Those numbers, Barber said, should be “concerning” for Connecticut’s economic prospects.

Factors Close to Home of Greater Concern

Overall, the survey indicates that Connecticut’s high net worth investors have more concerns about internal factors, while New York residents expressed greater concerns regarding external factors, such as the possibility of terrorism or foreign entanglements.  Connecticut investors were more concerned than their regional and national counterparts with regard to their families’ financial well-being or the ability to have sufficient funds to retire in their region of the country.  While 53 percent of those in Atlanta and 59 percent nationally expressed concern over their families financial well-being, in the tri-state region seven in ten (70%) expressed that concern, with the highest numbers in the region in Connecticut.

optimisticConnecticut’s high net worth investors, Barber said, are a savvy lot, reflecting greater knowledge of investments than the national numbers reflect, yet more than 7 in 10 say they consult financial professionals.  Another clear distinction came in the percentage of investors who said dividend-bearing stocks are a good investment:  49 percent nationally, 61 percent in the tri-state area, and 71 percent in Connecticut.  “There are clear indications that Connecticut’s high net worth investors are focused on opportunity,” Barber said.

High net worth investors, overall, are bullish on America.  In the tri-state region 61 percent of those polled said the U.S. was their first choice for a positive investment outlook for 2014, even higher than the 52 percent who expressed that view nationally. There were also differences across the country in the issues of particular concern to high net worth investors.  Regarding terrorism, 82 percent in the tri-state area, 66 percent in San Francisco and 63 percent in Denver indicated concerns, for example.

As part of the national survey of 1,004 US investors, age 25 to 75, with $100,000 or more in investable household financial assets, an oversample of about 300 tri-state area investors were interviewed. Approximately one-third of those interviewed had $1 million or more in household financial assets. The poll, released on January 29, 2014, was conducted October through December 2013, by GfK Public Affairs and Morgan Stanley Corporate Communications.

Morgan Stanley Wealth Management provides access to a wide range of products and services to individuals, businesses and institutions, including brokerage and investment advisory services, financial and wealth planning, banking and lending, cash management, annuities and insurance, retirement and trust services.

Pay Inequality Gap Widens in Greater Hartford; 8th Largest in U.S. Since 2008

If you thought the earnings gap between the “have’s” and “have-nots” in the Greater Hartford region has been widening in recent years, new data indicates your impression is correct.  The Hartford-East Hartford-West Hartford region ranks #8 among the nation’s metropolitan areas with the largest widening gap in employee earnings, when comparing those making less than, or more than, $50,000. The data was compiled from the U.S. Bureau of Labor Statistics.

Between 2008 and 2013, the gap in the increase in pay between those earning less than $50,000 and those making more than $50,000 was $5,347 – the eighth largest gap in the nation.  The pay increase for the lower paid employees since 2008 was an averpay inequalityage of $44, compared with a $5,391 average increase among those earning more than $50,000.

In analyzing the data, Bloomberg ranked the 49 metro areas with the most employed people on the difference in pay since 2008 between those earning more than $50,000 and those earning $50,000 or less.  Occupations with both annual median pay and total employment numbers were included. On average, more than 500 occupations in each Metropolitan Statistical Area were studied.

The widest gap was in the Washington-Arlington-Alexandria metropolitan area, at $9,603, followed by San Jose-Sunnyvale-Santa Clara at $7,837, and Riverside-San Bernadino-Ontario at $7,065.  Also with a wider gap than the Hartford region were metropolitan Sacramento ($6,368), theearnings gap 
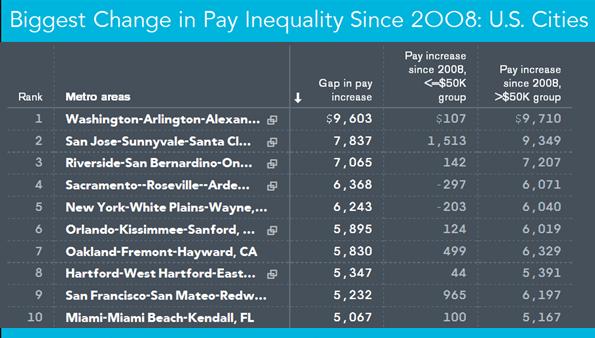
New York metropolitan area ($6,243), greater Orlando ($5,895) and metropolitan Oakland ($5,830).

The only big city in the U.S. where the gap between highest and lowest earners has narrowed since 2008 is Memphis, TN.

In the survey methodology, annual pay was employee-weighted and included base salary, cost-of-living allowance, guaranteed pay, hazardous-duty pay and incentive pay - commissions, production bonuses and tips. The analysis was released in December 2013, using the most recent data available.

Landlines Continue to Disappear in CT and Nationwide, New Federal Data Shows

One-fifth of all adults and one-quarter of all children under 18 living in Connecticut reside in households that have wireless telephones but no landlines, according to data compiled in the National Health Statistics Report.  For calendar year 2012, the most recent data available, 20.6 percent of adults age 18 and over and 25.4 percent of children under age 18 did not have a landline telephone in their home.

The report also indicates that in Connecticut, 20.6 percent of adults live in a wireless-only residence, 18.8 percent live in a mostly-wireless home, 32 percent live in a “dual-use” residence using both wireless and landline, 18.5 percent are mostly landline at home, and 9 percent have landline only.

Among children under age 18 in Connecticut, the growing dominance of mobile phones is evident, with nearly half in wireless-only (25.4 percent) or wireless-mostly (20.6 percent) households and 32.9 percent in dual-use residences.  Only 11.8 percent and 8.4 percent describe their household as being landline-mostlyphone pie or landline-only.

The National Health Interview Survey is the most widely cited source for data on the ownership and use of wireless telephones.  It is conducted by the Centers for Disease Control and Prevention’s National Center for Health Statistics, within the U.S. Department of Health and Human Services.

The report showed “great variation in the prevalence of adults living in wireless-only households across states.  Estimates for 2012 ranged from a high of 52.3 percent in Idaho to a low of 19.4 percent in New  Jersey.  Other states in which the prevalence of wireless-only adults was relatively high (exceeding 45 percent) were Mississippi (49.4%), Arkansas(49.0%), and Utah(46.6%).

Several other states in the northeascellphone survey health cover
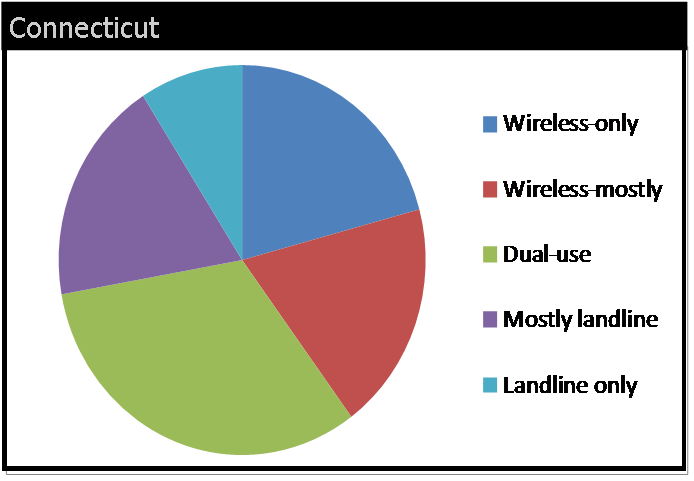
t joined New Jersey with prevalence rates below 25 percent, including Connecticut (20.6%), Delaware (23.3%), New York (23.5%), Massachusetts (24.1%), and Rhode Island (24.9%).

Results showed a great variation in the prevalence of wireless-only children across states, ranging from  a high of 63.4 percent in Mississippi to a low of 20.6 percent in New Jersey.  Other states with a high prevalence of wireless-only children included Idaho (62.2%), Arkansas (59.8%), Missouri (55.2%), and South Carolina (54.5%). Other states with a low prevalence of wireless-only children included Vermont  (24.5%), Connecticut (25.4%), Alaska (25.7%), and Massachusetts (26.7%).

The 2012 state-by-state data was released by the NHIS in December 2013.  At the same time, the agency released composite national data for the first six months of 2013 that indicates 38.0 percent of U.S. adults lived in a household that has only mobile telephone service and no landline. As reported in the Huffington Post, their tracking shows that more than half of adults under age 35 and nearly two thirds (65.6 percent) of those ages 25 to 29 are cell-phone only.

The Pew Research Center, in a spring 2013 survey, found that ror the first time, cell phone ownership among adults has exceeded 90 percent. Cell phones are now being used by 91 percent of adults, according to the Internet & American Life Project survey conducted between April 17 and May 19 of 2,252 adults.2013-12-18-cdcnhiscellonly

UConn Applications Climb; Board of Regents Makes Commitments on Remediation at White House Summit

Who is attending college in Connecticut – and who is not – was the central topic of conversation in Storrs and at the White House Thursday.

At a White House summit on expanding college opportunity, the Connecticut State Colleges and Universities (ConnSCU) system was among more than three dozen colleges, universities and systems issuing promises of specific policy steps to be taken to improve college access and completion rates, with a particular focus on low-income students.   Connecticut Board of Regents President Gregory W. Gray was among those in attendance.

As part of the day-long summit, the White House released a 90-page “Commitments to Action” summary that included new commitments from over 100 colleges and universities and 40 organizations “to build on their existing efforts.”  The steps the institutions will be taking follow calls from President Obama, Education Secretary Arne Duncan and others to improve higher education opportunity in the United States, in response to the nation’s diminishing standing compared with other nations.

As education, business awhite hosuend nonprofit officials were meeting in Washington, the University of Connecticut, the state’s flagship institution, announced that the number of high school students seeking admission to UConn’s Storrs campus next fall has jumped significantly over last year’s figures, comprising a pool of potential freshmen with even higher average SAT scores and more diversity than previous years’ applicants.

More than 29,500 students applied as of Wednesday’s due date, a 10 percent increase over last year’s number, according to UConn officials. The number of minority applicants also increased by 16 percent – described as an important consideratiouconn-new-logon in UConn’s commitment to diversity.   Officials pointed out that the jump in UConn applications runs counter to national and regional trends in which declines in the number of high school graduates have caused many universities to see their applications and enrollments level off or decrease.

Enrollment Moving in Opposite Directions

The Board of Regents system – which includes more than 90,000 students attending the state’s 17 public colleges and universities (except UConn, which is outside the system) – has seen the largest drop in students among the state’s public and private higher education sectors. At Connecticut's four state universities (Central, Eastern, Southern, Western), enrollment was down 2.2 percent to 34,062 this year compared to 2012, reflecting the continued losses in the number of part-time graduate students. Enrolllogo-connscument at the community colleges fell 2.1 percent to 56,977, reflecting losses in both full and part time students.

Full-time undergraduate enrollment among member institutions of the private Connecticut Conference of Independent Colleges (CCIC) rose by nearly 2.5 percent this past fall. In fact, nine of the 16 CCIC member institutions had an increase in enrollment and five of these institutions hit new enrollment records: Goodwin College, Quinnipiac University, Sacred Heart University, University of New Haven, and the University of Saint Joseph. In contrast, only five of twenty three public institutions showed an increase in enrollment.CCIC

According to Thursday’s newly released White House document, “Connecticut commits to planning an evaluation of pilot data to assess and improve upon efforts to implement remediation redesign throughout post-secondary institutions in the state.  Efforts will support improvements to remediation curriculum and practices on campuses.”  One of the panel discussion Thursday in Washington D.C. focused on the remediation issue, in which students graduating high school but not quite ready for college have traditionally taken non-credit bearing courses to prepare for college.

Focus on Remediation

The Connecticut legislature in 2012 passed a new law that requires public colleges to embed remedial education in credit-bearing courses, with extra tutoring and assistance for students who need remedial help. The bill had concerned some faculty at the institutions, who felt that abolishing all remedial classes would be unworkable, considering the learning deficiencies of some incoming students. Beginning with the Fall 2014 semester, the new law allows institutions to offer a student no more than one semester of non-embedded remedial support.

Connecticut wiCommitments to Actionll be hosting two upcoming events focusing on the remediation issue, the White House report indicated:
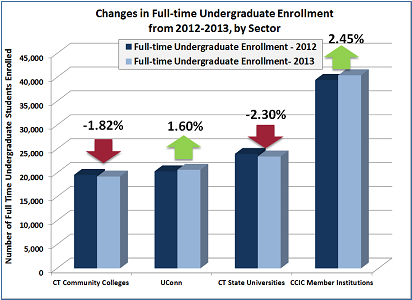
  • A“Multiple Measures Summit,” which will offer information and applicability of various methods of placement assessment for consideration of state community colleges and universities.
  • A “Remediation Conference,” which “will serve as an opportunity for state-wide collaboration outlining best practices of the piloting of intensive, embedded and transitional remedial education initiatives.  Data results will be shared along with ideas for scalability.”

The “Commitments to Action” document also notes that “The Board of Regents is currently conducting 139 pilots consisting of both math and English, intensive and embedded programming across the 17 ConnSCU institutions… Data will be analyzed by institution and system faculty/administration to highlight challenges for adaptation and strengths for duplication.”   It has been estimated that by 2020, 70 percent of Connecticut’s jobs will require post-secondary education.

Among UConn’s larger applicant pool, several stand-out programs – including engineering, business, digital media, and allied health sciences – are among the disciplines that saw significant increases in interest from the potential new UConn students who applied for admission.  With substantial financial support from the Governor and state legislature, UConn is investing in new faculty, updating its academic plan, and planning for the Next Generation Connecticut initiative to revolutionize its STEM (science, technology, engineering acollege enrollmentnd math) curricula.

UConn will begin notifying this year’s applicants with offers of admissions starting March 1, with the targeted new class of Storrs freshmen estimated to be around 3,550 students. The number of applicants has more than doubled since 2001, when the University received about 13,600 applications.

UConn’s Next Generation Connecticut initiative, a $1.5 billion 10-year state-funded investment, is expected to attract $270 million in research dollars, $527 million in new business activity, and fund the hiring of 259 new faculty members and the enrollment of an additional 6,580 undergraduate students, as well as the construction of new labs and facilities, expansion of digital media and risk management degree programs and development of student housing at UConn’s Stamford campus.

President Obama has set a goal of having the United States achieve the highest proportion of college graduates in the world by 2020.  The U.S., which was once ranked #1 in the world, has fallen from the top 10, and current projections indicate that decent will continue without corrective actions, such as those outlined by participants in the White House-led effort.

CT Ranked 23rd in Nation in Pay Equity; Women Earn 78 Cents to Men’s Dollar

What do Connecticut, South Dakota, South Carolina, Wisconsin and Washington have in common?  The paycheck gap between women and men in the five states is identical – and ranked 23rd among the nation’s 50 states.  In Connecticut and the other four states, women, on average, receive 78 cents for doing equivalent work as men earning a dollar, according to an analysis published by Forbes magazine.ACS logo

The top states – with the smallest earnings gap differential - were Maryland, Nevada, Vermont (a three-way tie for first place), New York, California, Florida, Hawaii, and Maine.

For more than a decade, the comparison between the median earnings of full-time employed men and women in the U.S. has remained a stubborn 77 percent – that is, women earn roughly 77 cents on the dollar. A glimmer of prgender-pay-gap-graphic-final
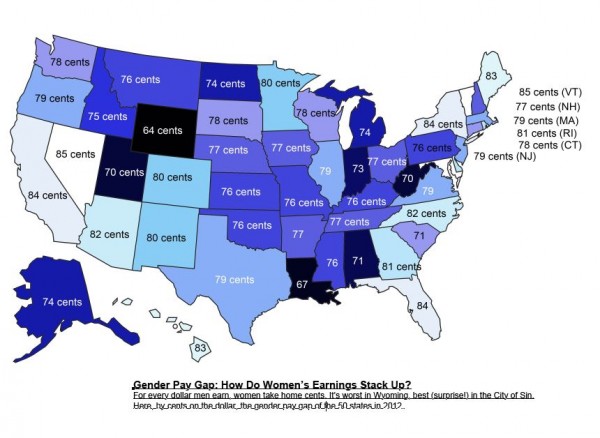
ogress is reflected in the total of 16 states in which women are now earning 80 cents or more to every male dollar, twice the count of 2010.

In Connecticut, just a penny above the national average, full-time annual earnings for women is $47,900; for men $61,097, according to the data.

Forbes analyzed data from the latest 2012 American Community Survey by the U.S. Census Bureau, using the mean earnings for full-time, year-round female workers by state.

Forbes pointed out that in Connecticut and New Jersey, both contiguous with New York, “women can expect healthy salaries—upwards of $47,000 as a median isn’t bad—but they earn 79 and 78 cents on the dollar respectively. Historically speaking, where there’s a large concentration of jobs in very high-paying occupations like finance, media and law, you’ll often (and unfortunately) find more men in those occupations than women which can skew the overall pay gap.”

The top 25 states:

  1. Maryland (tie-1st)
  2. Nevada (tie-1st)
  3. Vermont (tie-1st)
  4. New York
  5. California
  6. Florida
  7. Hawaii
  8. Maine
  9. Arizona
  10. North Carolina
  11. Georgia
  12. Delaware
  13. Rhode Island
  14. New Mexico
  15. Colorado
  16. Minnesota
  17. Texas
  18. Massachusetts
  19. Oregon
  20. Virginia
  21. New Jersey
  22. Illinois
  23. Connecticut
  24. Washington(tie-23rd)
  25. South Dakota(tie-23rd)
  26. Wisconsin (tie-23rd)
  27. South Carolina (tie-23rd)


High Tech Firms Driving the National Economy; Connecticut Slowed as Other Regions Grew

If you’ve wondered why Connecticut has been devoting significantly increased economic development attention on high tech start-up businesses, encouraging and nurturing their development and offering financial incentives at every turn, a new national report on business start-ups in the sector may provide ample rationale.

High-tech startups are a key driver of job creation throughout the United States, according to research by technology policy coalition Engine and the EKauffman reportwing Marion Kauffman Foundation. The report, “Tech Starts: High-Technology Business Formation and Job Creation in the United States,” finds that high-tech startups are springing up at a higher rate than all private-sector businesses – and in more places around the nation.   A total of 384 metropolitan areas were analyzed, including four in Connecticut, using comprehensive data through 2010, the most recent available.

Relative to their share of firms in the economy, high tech is 23 percent more likely, and the ICT sector (Information and Communications Technology), as a segment of high tech, is 48 percent more likely, than the private sector as a whole to witness a new business formation.

usa Though they start lean, new high-tech companies grow rapidly in the early years, adding thousands of jobs along the way, according to the study findings. In fact, high-tech startup job creation is so robust that it more than makes up for the job destruction from early-stage businesses failures – a key distinction from the private sector as a whole where job losses from early-stage failures turns this group into net job destroyers, the report indicated.

However, as the density of high tech firms has grown in metropolitan areas across the country, it has not happened in Connecticut, as data reveals a reduction in the density of high tech firms in the state’s major metropolitan areas during the past two decades.  (The U.S. average is 1.0.)

New Haven-Milford’s start-up density went from 1.1 in 1990, when it was one of nearly 70 metropolitan areas above the national average, to .5 in 2010, while the ICT sector start-up density dropped from above average at 1.2 in 1990 to .5 twenty years later.    The Norwich-New London metropolitan area reflects a drop from 1.1 to .8 in high tech start-up density and 1.1 to .9 in the ICT sector comparing 1990 and 2010.

The data indicate that the Hartford-West Hartford-East Hartford area reflected decreases from .9 high tech start-up densities in 1990 to .6 in 2010, and .8 ICT start-up density in 1990 to .7 two decades later. The Bridgeport-Stamford-Norwalk metropolitan region showed a drop from 1.4 to .9 in high tech start-up density over the 20 year period, moving from above to below the national average, and a parallel drop of 1.6 to 1.1 in ICT start-up density.

The website Engine, which collaboratedstart up density in the report, observed that “Each of the high density metro areas has one of three characteristics, and some have a combination of them all: 1) They are well-known tech hubs with highly skilled workforces, 2) They have a strong defense or aerospace presence, and 3) They are university cities.”

The report noted that “”high-tech startups are being founded across the country fueling local and national economic growth…and are a pervasive force in communities throughout the country.”  The Top 10 Metro Areas for High-Tech Startup Density (1990 and 2010 data):

  1. Boulder, Colo.  (High-tech 4.0 to 6.3; ICT 4.7 to 6.1)
  2. Fort Collins-Loveland, Colo. (High-tech 1.0 to 3.2; ICT 1.1 to 2.6)
  3. San Jose-Sunnyvale-Santa Clara, Calif.  (High-tech 3.0 to 2.6: ICT 4.4 to 2.9)
  4. Cambridge-Newton-Framingham, Mass. (High-tech 2.0 to 2.4; ICT 2.0 to 2.3)
  5. Seattle, Wash.
  6. Denver, Colo.
  7. San Francisco, Calif.
  8. Washington-Arlington-Alexandria, DC-Va.-Md.
  9. Colorado Springs, Colo.
  10. Cheyenne, Wyo.

"This report confirms the dynamism of the technology sector and its disproportionate contributions to the U.S. economy. It also underscores the need for policies that enable and support that dynamism," said Dane Stangler, director of Research and Policy at the Kauffman Foundation.

The report, released earlier this year, used data from the Business Dynamics Statistics (BDS) series, which is compiled by the U.S. Census Bureau and tracks the annual number of new businesses (startups and new locations) from 1976 to 2011.  Ten of the 14 high-tech industries can be classified as information and communications technology (ICT), while the remaining four are in the disparate fields of pharmaceuticals, aerospace, engineering services and scientific research and development.

In explaining the report, Engine noted that “While high-tech firms start small, they scale rapidly in the early years. So much so that young high-tech firms--those aged one to five years--contribute positively to net job creation overall. The opposite is true across the private sector as a whole, where the substantial job losses stemming from early-stage business failures - about half of all firms fail in their first five years - make young firms as a whole net job destroyers. Even when we remove the job destruction from all early-stage firm failures, surviving young high-tech businesses create jobs at a rate twice that of surviving companies in the private sector as a whole.”

Exodus: Connecticut Ranked #1 in People Moving From State

Connecticut residents are on the move.  Out.

The state led the nation with the highest percentage of outbound moves in 2013, according to Atlas Van Lines’ annual report of moves throughout the U.S. and Canada. Of 2,055 residents' moves during the year, 1,230 of them, or 60 percent, were out of state – the highest percentage in the nation.  That's compared to 825 moves from other states into Connecticut.new_atlas_logo

A year ago, Connecticut was #7 in the nation in the ratio people moving out-of-state, with 1,123 outbound and 834 inbound moves, in a survey by United Van Lines.  This year, Connecticut led the nation in outflow of residents in the Atlas Van Lines survey.

us moving mapDuring the past five years, inbound moves peaked in 2010 at 1,009 – with a just slightly higher  1,160 outbound moves.  Since then, the numbers have skewed increasingly out-of-state, Atlas reported.

The 2013 year was the state's highest outbound percentage and highest total number of outbound moves since 2009.  Connecticut has been an outbound state for six of the past ten years, including the past three consecutively, according to Atlas.  An “outbound” state is defined as one that has more than 55 percent of moves outbound.

The remainder of the New England states were "balanced" in 2013, with the exception of New Hampshire, which was considered an inbound state in 2013. The data indicates that progressively fewer people were moving into Connecticut in the last three years, a pattern not consistent throughout New England.  None of the other New England states were outbound states in 2013.  In the previous year, Maine joined Connecticut as an outbound state in the United Van Lines survey.

States that saw the greatest percentage of inbound movers: North Dakota, North Carolina, and Texas.  States with the highest outbound move percentage after Connecticut were New York and Indiana, both at 59 percent.  Only 12 states were net outbound states:  Connecticut, New York, Indiana, Wyoming, Delaware, Nebraska, Minnesota, Illinois, Indiana, Ohio, Pennsylvania, and New Jersey.Connecticut

The Greenwich Time reported that the branch manager of Danbury's Certified Van Service of Connecticut say, his truckers – part of the United Van Lines company - relocated about 100 families from the Hartford area to Charlotte, N.C., and from Fairfield County to Atlanta. For Kevin Kaster, president and owner of Kaster Moving in Stamford, the study confirms one trend he's recently experienced.  "Texas has been a hotspot the last two years, no question," he said. "An inordinate amount of people from around here are going to Texas."  Brielle Sollinger, aoutboundssistant marketing manager at Fallon Moving and Storage in Windsor, agreed.   "Texas is big. We also do lots of Virginia, North Carolina and South Carolina," she said in a phone interview Friday afternoon.

Atlas reported that across the nation, most states were balanced evenly between inbound and outbound moves. The company also reported that the number of total moves increased during the year, something it said could be an indicator of an improving economy.  The data covered the period from January 1 through December 31, 2013.

Connecticut Ranks #42 in Population Gain Between 2010 and 2013; New England Lags Nation

Connecticut’s population grew six-tenths of one percent between 2010 and 2013 according to estimates by the U.S. Census Bureau, ranking the state 42nd among the nation’s 50 states in population growth.  The state population, which was 3, 574,097 at the 2010 U.S. Census was estimated at 3,596,080 as of the official July 2013 estimate, announced at year’s end.

The 2013 estimates also show the nation's population grew by 2.4 percent in the three years since the 2010 Census, with the South and the West leading the expansion. The total for the 50 states, the District of Columbia and Puerto Rico rose from 308,745,538 in 2010 to an estimated 316,128,839 in July 2population graphic013.  Only Rhode Island lost population (1,056 people) during the period, and the Southern and Western states accounted for more than 80 percent of the growth nationwide.

The bottom twelve states in population growth – all under one percent - include five from New England:  Rhode Island, Maine, Vermont, New Hampshire and Connecticut.  The remainder are in the Mid-West.  Massachusetts population grew by 2.2 percent, New Jersey by 1.2 percent, and New York by 1.4 percent.

The South, the nation's largest population center, also had the highest percentage-point growth at 3.3 percent: CT populationfrom 114,555,744 in 2010 to an estimated 118,383,453 in 2013. The West was close behind, with a 3.2 percentage-point growth during the period, from 71,945,553 in the 2010 Census to an estimated 74,254,423 in July 2013.

The Midwest region had the smallest growth, at 0.9 percent: 66,927,001 people in 2010 to 67,547,890 in 2013, according to published reports. The population growth for the Northeast was 1.1 percent between 2010 and 2013, growing from 55,317,240 in 2010 to 55,943,073, according to the census estimates.

The bottom twelve, including Connecticut, saw increases of less than one percent, including Rhode Island’s drop in population, and Maine standing essentially even, adding less than 1,000 people.

  • Rhode Island -0.1people
  • Maine   0.0
  • Michigan 0.1
  • Vermont 0.1
  • West Virginia 0.1
  • Ohio 0.3
  • Illinois   0.4
  • New Hampshire 0.5
  • Connecticut 0.6
  • Pennsylvania 0.6
  • Mississippi 0.8
  • Missouri 0.9

The new figures from the Census Bureau shows Massachusetts is continuing to add to its population. The latest estimate as of July 1 puts the state's population at nearly 6.7 million, up by more than 47,000 from July, 2012.  Massachusetts' ranking is the 14th most populous state in the country.

New York remains the third most populous state in the nation -- behind California and Texas -- but the state's lead over fourth-place Florida continues to erode, according to 2013 population estimates. New York saw an increase of 1.4 percent from 19,378,102 people in the 2010 Census to 19,651,127 in the 2013 estimate, according to the bureau.

Florida's population in the 2010 Census was 18,801,310, about 576,000 fewer than New York's 2010 Census population. However, Florida's population rose an estimated 4 percent between 2010 and 2013, to 19,552,860 -- about 98,000 fewer than New York's 2013 population estimate.  Some have projected that Florida will overtake New York in population next year.

North Dakota, with its expanding oil and gas industry, led the growth chart between 2010 and 2013, at a 7.6 percent clip, including a 3.1 percent population increase in just the past year.

For the 12 months ending July 1, 2013, population growth nationwide was 0.71%, or just under 2.3 million people. That's the slowest since 1937, USA Today reported.  An aging Baby Boomer population and slower immigration combined for what the newspaper described as “nearly stagnant U.S. population growth,” the slowest pace since the Great Depression.

Maine and West Virginia were the only two states to lose population between 2012 and 2013.  The Census Bureau estimates that Connecticut picked up 4,315 residents in that 12-month period.

Task Force Report on State Response to Alzheimer’s Nears Completion

Thirty-one states have published a plan to respond to what advocates describe as the “escalating crisis” of Alzheimer’s Disease. Connecticut may be next, and is one of 13 states currently in the midst of developing plans.

The Connecticut Chapter of the Alzheimer’s Association was among the leaders in crafting and shepherding legislation in the 2013 General Assembly session to create a task force to study the care provided to persons diagnosed with Alzheimer's disease and dementia in the state.  That Task Falzheimers-wordsorce has been up and running throughout the fall, and is poised to announce its recommendations next month, just ahead of the start of the 2014 legislative session in February.

The 23-member task force of key agencies and community stakeholders convened in September, under the auspices of the Legislative Commission on Aging, to prepare findings and recommendations on ways to improve early detection, better coordinate health care services, set training requirements for health care providers and other professionals, services for early-stage and younger onset, and support to family caregialz mapvers.

The Task Force was co-chaired by State Commissioner on Aging Edith Prague and Rep. Joseph Serra of Middletown.  Members included Laurie Julian of the Alzheimer’s Association in Connecticut and other diverse community stakeholders appointed by legislative leadership and representatives from state agencies including the Department of Public Health, Department of Emergency Services, Department of Banking, Department of Labor and Department of Social Services, as well as six current legislators.

Over 5 million Americans are living with Alzheimer’s, and as many as 16 million will have the disease in 2050. Nearly one in every three seniors who dies each year has Alzheimer’s or another dementia. The cost of caring for those with Alzheimer’s and other dementias is estimated to total $203 billion in 2013, increasing to $1.2 trillion (in today’s dollars) by mid-century. Between 2000 and 2010, nationally, the number of people who died as a result of breast cancer, prostate cancer, heart disease, stroke and HIV all declined, while the number of people who died with Alzheimer’s increased by 68 percent.

In Connecticut, there were 820 deaths due to Alzheimer’s Disease in 2010, there are more than 63,000 individuals with Alzheimer’s in nursing homes in the state and it is estimated that 68% of nursing home residents have a cognitive impairment. As of 2010, there were an estimated 2,800 people between age 65-74 with Alzheimer’s in Connecticut, 30,000 between 75 and 84, and 37,000 age 85 or older.

The task force, in accordance with the legislation, will make recommendations in areas including:alz stats

  • services provided to persons diagnosed with Alzheimer's disease and dementia; including persons with early-state and early-onset of Alzheimer's disease, and such persons' family members and caregivers
  • legislative policy changes to better serve such persons, family members and caregivers;
  • coordination between state agencies and private community-based health care providers to serve such persons, family members and caregivers;
  • case management services for such persons, family members and caregivers;
  • the transition of such persons from one health care facility to another; and
  • the placement of such persons in community-based settings or health care facilities other than nursing home facilities, when feasible.

The state legislature acknowledged the growing numbers of residents impacted by the disease, passing the bill unanimously earlier this year, with 67 co-sponsors. It was signed into law in June by Gov. Malloy.  The Alzheimer’s Association has been actively involved in the effort. The organization’s   Connecticut chapter is based in Rocky Hill, with regional offices in Hamden, Norwalk, Norwich and New Milford.

In accordance with the legislation, the task force report is due to be published early next month, according to officials at the State Legislative Commission on Aging.


18 Connecticut School Districts Named to Advanced Placement Honor Roll

Eighteen Connecticut school districts have been named to The College Board’s 4th Annual AP District Honor Roll — a list of 477 districts across the U.S. and Canada being honored for increasing access to AP (Advanced Placement) course work while simultaneously maintaining or increasing the percentage of students earning scores of 3 or higher on AP Exams.

Reaching these goals indicates that these districtsAP district are successfully identifying motivated, academically prepared students who are likely to benefit from rigorous AP course work, according to The College Board.

The Connecticut school districts include public schools in Berlin, Brookfield, Cheshire, Clinton, East Hampton, Ellington, Enfield, Fairfield, Greenwich, Killingly, Monroe, Newtown, Southington and Wallingford, as well as Regional School Districts 8 (Hebron, Andover, Marlborough), 14 and 18 and the Diocese of Bridgeport.

Most of the districts had received similar recognition in previous years; new to the list are Wallingford, Regional Districts 14 (Woodbury and Bethlehem) and 18 (Lyme and East Lyme), Killingly, Greenwich, Clinton, Fairfield and Enfield and the Diocese of Bridgeport. A year ago, there were 26 Connecticut school districts recognized on the AP District Honor Roll.

 AP is a rigorous academic program that offers more than 30 courses in a wide range of subjects and college-level assessments developed and scored by college and university faculty members and experienced AP teachers. According to the College Board, a score of 3 or higher on an AP exam represents the score point that is predictive of college success and college graduation. The AP courses offered various by school dstudents hsistrict, but often include biology, chemistry, physics, Spanish, U.S. history, English literature, and calculus.

Helping more students learn at a higher level and earn higher AP scores is an objective of all members of the AP community, from AP teachers to district and school administrators to college professors, officials at The College Board point out. They noted that many districts are experimenting with a variety of initiatives and strategies to determine how to simultaneously expand access and improve student performance.

Inclusion on the 4th Annual AP District Honor Roll is based on the examination of three years of AP data, from 2011 to 2013, for the following criteria.

  • Increased participation/access to AP by at least 4 percent in large districts, at least 6 percent in medium districts, and at least 11 percent in small districts;
  • Increased or maintained the percentage of exams taken by African American, Hispanic/Latino, and American Indian/Alaska Native students, and;
  • Improved performance levels when comparing the percentage of students in 2013 scoring a 3 or higher to those in 2011, unless the district has already attained a performance level at which more than 70 percent of its AP students are scoring a 3 or higher.

In 2013, more than 3,300 colleges and universities around the world received AP scores for college credit, advanced placement and/or consideration in the admission process, with many colleges and universities in the United States offering credit in one or more subjects for qualifying AP scores.

Regional School District 14’s Superintendent, Jody Ian Goeler said, “It is wonderful to see so many of our High School students challenging themselves to take and succeed in our most rigorous courses. It is a strong indication our Board of Education’s advocacy for these programs is well placed and providing excellent opportunities and results for our students.”

Greenwich High School Principal Chris Winters recently commented that “Our participation in AP  classes is at a 10-year high, and the average score has remained unchanged and at very high levels. For the first time, over 50 percent of Greenwich High School have passed at least one AP exam during their four years.”

Nationwide data from 2013 show that among African American, Hispanic, and Native American students with a high degree of readiness for AP, only about half of students are participating. These 477 districts, The College Board indicated, are committed to expanding the availability of AP courses among prepared and motivated students of all backgrounds.